Why Go On Journeys?

Because in new surroundings we must look more closely.  Seeing something familiar in a new context could disrupt how we’ve been imagining it to be.  We might recognize how it really is, how it is now.

What struck me first on this year’s journey to Nepal is air travel may be at the peak of an unsustainable growth path.  The first time I flew on a 747 was 1970 when I came to the USA.  They’re magnificent aircraft.  No surprise they’re still in service more than 40 years later.   In information theory no surprise means no information.  We have not been surprised by changes in air travel in the last four decades because the experience is little different.  Less than 40 years before 1970, however, it took not hours but 6 days to fly from England to India.  That was a dramatically different experience.

The great change in air travel since 1970 is enormously increased volume.  We do notice more crowding, less service and so on, but because the degradation has been stepwise we haven’t been provoked to think about the cumulative effect.  I do notice it on this trip, first because when my flight from Boston arrives at Heathrow’s new Terminal 5, the shuttle, with no stops or traffic jams, takes fully 15 minutes to reach Terminal 4 for my flight to Doha.

When we approach Doha, it’s over scattered islands of apartment buildings propagated as if by winds over the featureless desert.  The airport, already a vast expanse of runways and buildings, is soon to be replaced by an even greater complex.  Even now it’s a 20 minute walk from where I disembark to the gate for Kathmandu.  When we take off, it’s over a mass of shiny new skyscrapers.  The entire spectacle is surreal.

All this vibrant life is possible only because there’s oil under the desert.  I remember Shelley’s poem, Ozymandias, whose statue was the only thing left of the empire it once surveyed.  How will these colonies survive when the oil is gone?  How long can we continue to fly?


Social Security – Past and Future Changes

Social Security was originally established as insurance.  The Old-Age, Survivors, and Disability Insurance Act (OASDI) was for those who became unable to support themselves.  At that time, during the Great Depression, the poverty rate among senior citizens was over 50%.  OASDI became a pension plan a half century later when in 1983, President Reagan sponsored an increase in Social Security taxes, changing the program from pay-as-you-go to collecting more than it paid out.  When OASDI was established, life expectancy was only 62 and benefits became payable at 65.  Ever-improving medical technology raised life expectancy, however, and folks came to expect they would live long enough to get a Social Security pension.  The change made in 1983 recognized that new reality.  Boomers would prepay part of their old age benefits.

Social Security then began accumulating a surplus.  It took in $95 billion more than it spent last year and ended 2011 with a $2.7 trillion surplus.   Of course, surpluses every year forever were not expected.  The accumulated surplus would at some point start to be drawn down and what was taken in would be brought into balance with what was paid out.  But now there’s a new factor; not only is life expectancy increasing, the birth rate is dropping.  That means fewer workers contributing to Social Security as well as more people getting benefits.  We now have 66% workers and 14% folks 65 or older.  The US Census Bureau projects that by 2050 we will have 60% workers and 21% folks 65 or older.  That means the ratio of contributors to benefiiciaries will plummet from 5:1 to 3:1.

Even so, our demographic prospects are better than most.  China has 74% workers and 9% 65 or older today but is projected to have 60% workers and 27% 65 or older in 2050.  Its working age population is projected to be 200 million lower by 2050 while ours will be 50 million higher.  Nonetheless, our steeply dropping ratio of contributors to beneficiaries must be acted upon and it will get worse unless we also increase job creation.  Social Security trustees project the program will start to pay out more in 2021 than it takes in and the surplus will be gone in 2033.  Only enough tax revenue will then be collected each year to pay about 75% of benefits.

An additional issue is that the Social Security surplus was supposed to be invested in interest-bearing federal bonds but there is no trust fund in the sense most of us imagine.  That $2.7 trillion surplus was already spent on other things.  It exists only as a part of our overall federal debt.  It is, of course, backed by the full faith and credit of the US government.

And there’s one more very important change to consider.  Social Security taxes increased in the last half century while income taxes shrank.  From 1961 through 2011, Social Security taxes grew from 3.1% of GDP to 5.5%.  Personal income tax dropped from 7.8% to 7.3%, most of that decrease benefitting those in the top 1% of incomes (the top rate fell under Reagan from 70% to 28%).  Corporate income tax fell from 4% to 1.2% (the rate fell from 50% of profits to 35%).  What happened, in other words, is corporate income tax fell by 2.8% while Social Security taxes increased by an almost identical 2.4% and since Social Security tax is capped, most of the burden of the tax increase was born by the bottom 90%.

So now it’s time for another major update of the Social Security program.  What could we do?  What should we do?  And when should we do what?

The AP recently used data from the Social Security Administration to calculate how much of the projected shortfall would be eliminated by various options. To highlight the urgent need for action, they also calculated what would have been eliminated if those options had been adopted in 2010.  I’ve also incorporated some data from David Cay Johnston.  First, what could we do and why should we do something soon?

1)  We could raise the payroll tax ceiling to generate more revenue. If we restore the Reagan standard that 90% of wages are taxed instead of today’s 83%, the tax would now apply to close to $200,000 of wages not $110,100.  Workers making $200,000 in wages would get a tax increase of $5,574.  If we entirely eliminate the ceiling and levy the tax on all wages, we would eliminate 72% of the shortfall. Two years ago, we would have eliminated 99%.

2)  We could also generate more revenue by raising the tax rate.  If we raise it by 0.1% a year for 20 years until it reaches 14.4% versus the current 12.4% (of which workers and employers each pay half but for 2011 and 2012, employees temporarily pay only 4.2%), workers making $50,000 a year would get a tax increase of $500. That would eliminate 53% of the shortfall. Two years ago, it would have wiped out 73%.

3) We could also get more tax revenue by increasing wages, which had fallen in 2010 back to the 1999 level, and by creating more jobs, which grew at only a fifth the rate of population increases since 2000.

4)  Or we could cut the outflow by raising the retirement age.  If we gradually raise it from 66 for full retirement benefits (67 for those born in 1960 or later) to 68 in 2033, that eliminates 15% of the shortfall. Two years ago, it would have eliminated 20%.  If we go to 69 in 2039 and 70 in 2063, that eliminates 37% of the shortfall. Two years ago, it would have eliminated half.

5)  We could also cut the growth of payouts by changing the inflation index that governs benefit increases.  If we use the Chained CPI, which assumes people change what they buy when prices increase, that would eliminate 19% of the shortfall. Two years ago, it would have eliminated 26%.

6)  Or we could reduce benefits for those with lifetime wages above the national average, currently about $42,000 a year.  If they still got more than lower paid workers but not as much more as now (the average monthly benefit for a new retiree is $1,264), we could eliminate 34% of the shortfall. Two years ago, we could have eliminated almost half.

Which of these options should we adopt?

Since the fundamental problem is the greatly increasing ratio of those getting pensions to those contributing to the program, option (4) seems appropriate.  The AP only calculated the result of raising retirement age from 67 to 70.  We could go further.  When Social Security was established, most folks expected to continue supporting themselves throughout their life.  The idea that most of us can retire is quite recent.  But the issue with this line of thinking is that those who most need the Social Security retirement benefit have low wage jobs that tend to be least suitable for older people.  Those with higher paying jobs can invest in their own pension plans, can more easily continue working while their body ages, can better mitigate the effects of aging, and are more likely to have work that remains attractive.  So maybe we should also adopt option (6) because higher income folks can increase their retirement benefits by investing in a supplementary plan.  Option (5) seems a gimmick, a way to avoid addressing the underlying challenge.

Our culture has changed enough in the last century (I hope) that winding down Social Security is not an option.  Most of us now need an employer so we can support ourselves, and we need to be well enough to work.  More people do become self-employed when there’s a persistently high lack of jobs but they will never be more than a minority in today’s economy.  Granted, we have many people living on the streets begging and/or thieving, we support by far the world’s greatest number of citizens in jail, and we have people benefitting from Social Security who should be working, but most of us now favor OASDI because we know people can’t always get a job.  If today’s Great Recession degenerates into another Great Depression, only the uber-rich may disagree.

So the more difficult question is to what extent we should increase Social Security’s revenue.  Recall that the payroll tax ceiling was higher under Reagan and we could (option 1) eliminate much of the projected shortfall by reinstating that level.  We could also secure the program’s finances by slowly raising the tax rate (option 2).  That seems reasonable since future beneficiaries are likely to receive more benefits for a longer time but I prefer option (1), eliminating the ceiling altogether, because that would partially reverse the 1961-2011 shift in tax collection from high to lower income folks.  Our society was not improved by that shift.

The greatest challenge is implied by option (3), increasing wages and creating more jobs.  It’s easier to imagine an accelerating reduction in the number of jobs for humans as more and more jobs can be done by computers and robots.  I touched on this in other posts and will return to it in more depth.  Planning for society with only the jobs that will still be available to humans in 2050 may be our greatest strategic challenge.  But today we need to address the more immediate problem, preventing Social Security from being defunded.

Fear, Greedy Fear and the Indicated Strategy

Why are folks buying today’s very low paying bonds or depositing cash at negative real interest rates?   It’s true they’ll be better off with cash if there’s another market collapse.  It’s possible they can sell bonds to a “bigger fool” at an even higher price in future.  But by avoiding the risk of sudden loss they guarantee getting wiped out gradually by even moderate inflation, and most of them will not in real life sell their bonds before the price collapse when interest rates rise.  Fear is preventing them from a rational assessment of risk, fear alone in the case of cash, greedy fear in the case of bonds.

In his 1936 “General Theory of Employment, Interest and Money” Keynes wrote: “If we speak frankly, we have to admit that our basis of knowledge for estimating the yield 10 years hence of a railway, a copper mine, a textile factory, [or etc] amounts to little and sometimes to nothing” and “If human nature felt no temptation to take a chance, no satisfaction (profit apart) in constructing a factory, a railway, a mine or a farm, there might not be much investment merely as a result of cold calculation.”

We cannot eliminate risks, only choose which ones to take.  When we are consumed by fear, we underestimate the impact of avoiding short term risks and of failing to take longer term ones.

How is our government (and others) responding to the current bubble in fear?  With monetary policy, specifically quantitative easing.  By raising the cost of holding safe, liquid assets they hope to encourage investment in more productive and riskier ways because safe assets are, as a result of QE, guaranteed to lose money in the long term.

But Keynes said, and we are now living in such a time, monetary policy can not always overcome a bubble in fear.  If private investors will not invest, he said, governments must.  Because they can spread risk across the whole of society, governments can accept higher risk.  They will not necessarily make better decisions, Keynes said, but state-led investment is necessary for an economy paralyzed by fear.  I cannot fault his logic.  I introduced what looks like the best candidate for such investment, renewable energy, in a previous post about monetary policy and will return to it in more detail.

High Unemployment -> Lower Earnings -> Further Economic Decline

At 15% of the civilian labor force, total unemployment was down last month from its 17% high in October 2009, but it was still almost twice as high as before it rocketed up from the start of 2008.

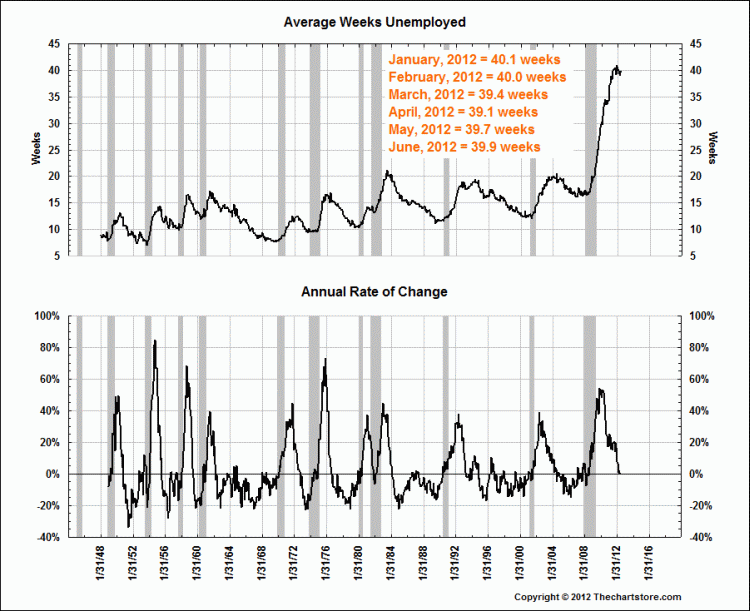
At 40 weeks last month, the average number of weeks unemployed has not changed this year after increasing sharply from less than half that level at the start of 2008.  The rate of change was very high during 2008.  It  dropped rapidly since the start of 2010 to stabilize at the current exceptionally high level.

Employment continues to drop in federal, state and local governments, all of which get less tax revenue because our economy is in recession.  They account for a little under 17% of total non-farm payroll.  In the goods producing sector which accounts for 14% of total non-farm payroll, we see 2% growth in manufacturing from one year ago.  In the service sector, 70% of total non-farm payroll, we see 3% growth in professional and business services, 2% in education and health, 2% in leisure and hospitality, and a small drop in information services.

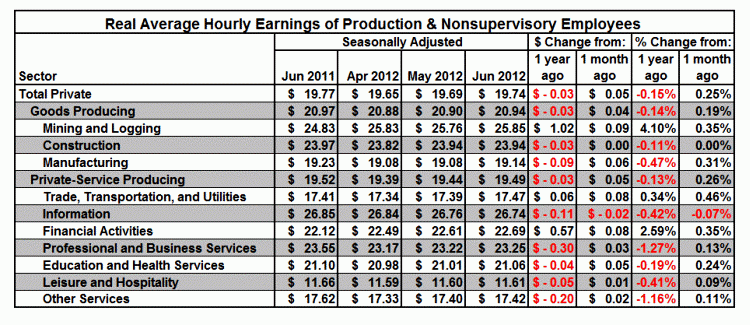
Persistently high unemployment has driven average hourly earnings down from a year ago.  The only exceptions are mining and logging, the second highest paid sector, which is up 4%, financial activities up 3%, and trade, transportation and utilities, the largest individual sector payroll, which is up 0.34%.

Professional and business services, the sector with the highest payroll growth, had, at 1.27%,  the greatest drop in average earnings from a year ago.  Manufacturing, the highest payroll growth goods-producing sector, had the next highest drop in average earnings, down 0.47% from a year ago.   Information services, the only service sector where payroll dropped, had the next highest decline in average hourly earnings, 0.42%.  That is almost identical to the 0.41% drop in average hourly earnings for the sector where average earnings are by far the lowest, leisure and hospitality.

Continued tax cuts will drive continued cuts in government payrolls, which will worsen our economic decline.   People without earnings can spend only what is transferred from those who do.   We must restructure our federal budget as I’ve noted in posts at http://usaturnaround.wordpress.com/ But as I’ve also noted there, we must at the same time restructure our economy.  We must create more jobs.  Without jobs there are no earnings, and without earnings there is no economy.

The big question is what kind of jobs in which sectors?  More and more jobs can be done at lower cost by workers in other countries, or by machines.  Businesses will, and should, continue to cut their high cost payrolls.  They have no incentive to form strategies to increase  US payrolls.  Politicians do have that incentive but chiefly in the short term, between now and their next election.  That is OK when the world is not changing but this is not such a time.  We must figure out how our society and economy should respond to currently unfolding great changes, identify the projects to achieve that transformation, and mobilize our workforce.

I began to explore this at the end of my previous post, “Monetary Policy, Fiscal Policy – What to Do?” at  http://martinsidwell.com/?p=117 and will continue.


Monetary Policy, Fiscal Policy – What to Do?

Why isn’t our monetary policy working?  Set and executed by the Fed, it aims, by expanding or contracting the supply, cost and availability of money, to increase economic growth and lower unemployment, or cut inflation.  But we are stuck in low growth and high unemployment despite an extraordinarily expansionary policy.  What should we be doing?

The Fed continues to greatly expand money supply and it has for many years cut to unprecedented lows the cost of borrowing money.  In “normal” times that encourages more borrowing.  Those very low interest rates did  fuel borrowing for investment in dot-com and real estate price boom/bubbles.  They also enabled ongoing consumption that exceeded income.  But then the bubbles burst and asset values collapsed.   That was the start of “new normal” times.  Borrowers no longer had sufficient assets to support more borrowing, greed was supplanted by fear, and folks began repaying existing debt while they still had income.  Making borrowing more attractive is useless when borrowers cannot or will not borrow more.

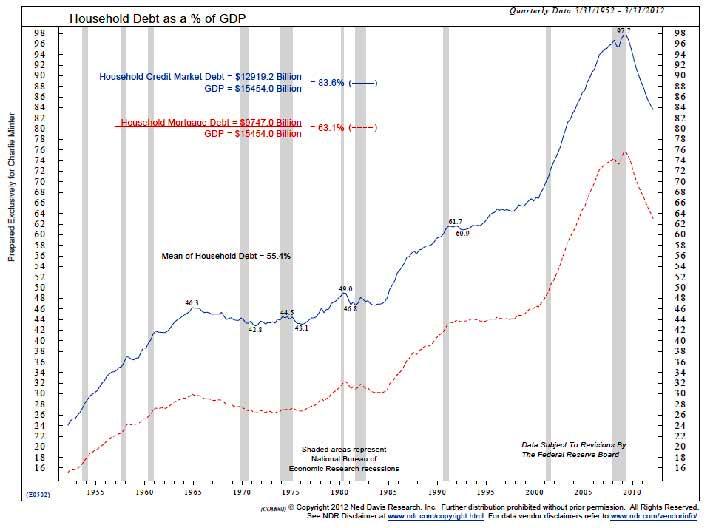
Expansive monetary policy is not working now because we are in a balance sheet recession.  More specifically, we are in a household balance sheet recession.  Mortgaged real estate is by far the largest asset of most households.  While the real estate bubble was expanding they could get ever-larger mortgages and equity loans.  Now they can’t.  They can no longer continue borrowing to spend more than they earn.  Since household spending accounts for 70% of USA GDP, that hurts all across the economy.  The following chart illustrates the severe contraction of household debt in the last couple of years and suggests it will continue for at least another four years before it’s back to what could be a “normal” level.

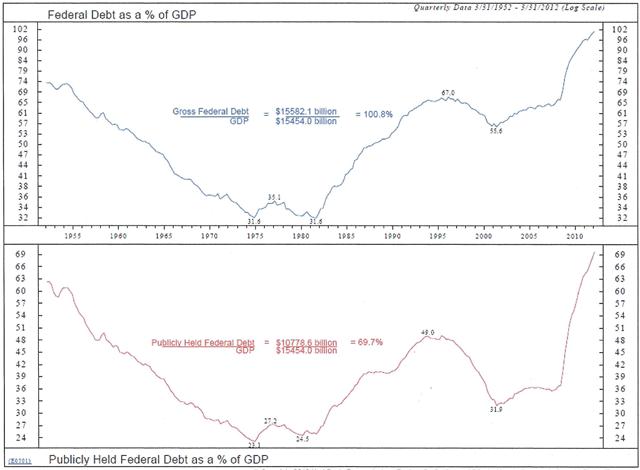
Lower household spending resulted in a contraction of economic growth, which shrank income growth and raised unemployment.  That led to lower tax revenue and higher welfare program spending that compounds the preexisting imbalance between government income and spending.  While our household debt drops, our public debt soars.

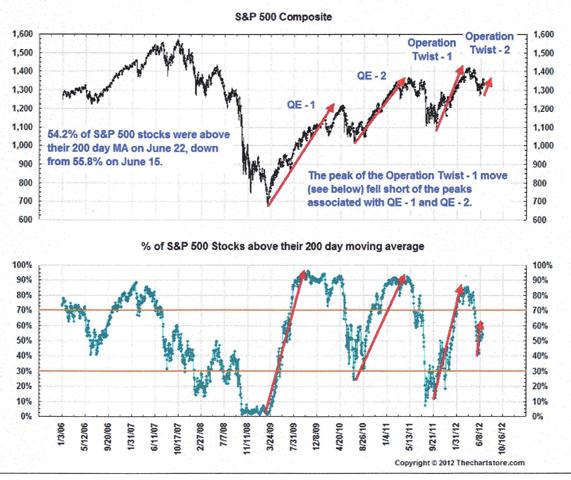
Low interest rates help in one important way by minimizing the cost of public debt.  They hurt by minimizing the income of pension funds, insurance companies, and all fixed income investors whose spending commitments depend on a “normal” rate of return.  Their “new normal” income is often significantly below their committed spending.  And QE, the Fed’s injection of new money into the economy, helps equity investors only temporarily:

QE stimulates the  confidence fairy but she stops dancing when QE ends.

Large enterprises that account for most of the S&P 500 are helped by low interest rates, they refinance existing borrowing at lower rates, but they have no need or desire to borrow for expansion.  For one thing, they already have sufficient resources; more importantly, they do not expand production in face of shrinking demand.

The big banks are in better shape than when the real estate bubble burst.  The Fed bought large amounts of their bad loans and the value of their assets now appears to be in better balance with their liabilities.  But their assets may have much less value than appears.  The value of property against which they made loans  is now much lower.  Derivatives they own based on those loans may have no value at all.  Instruments they sold that insure against such risks may trigger payouts higher than they could make.  Big banks are now afraid to lend to each other because they do not know if either they or their counter-party is solvent.

What will happen if we stay on this course?  It looks like deflation first, then inflation.  We’re getting lower-than-expected results or declines in GDP, job growth, retail sales, income growth, manufacturing production, core capital goods orders, vehicle sales and initial unemployment claims.  We have uncertainty about tax rates, an imminent “fiscal cliff” and a dysfunctional congress.  Commodity prices are declining worldwide, there’s a sovereign debt crisis in Europe, and ominous economic indicators in China, Japan, India, Brazil and other emerging nations.   Collapsing aggregate demand could force producers to cut prices to find buyers.  That would trigger rising unemployment and more defaults, bankruptcies and bank failures.  Deflation would be followed by inflation if the Fed and other central banks expanded the supply of money far beyond the value of what it could buy.

No need to flesh out how bad that could be.  What can we do to avoid it?  How can we stimulate growth and employment?

The indicated strategy is the opposite of our apparently emerging fiscal policy.  The National Association of Manufacturers and others estimate the Budget Control Act of 2011 which mandates $1.2 trillion of Federal spending cuts between 2013 and 2021 will cost one million jobs in the private economy by 2014, drive unemployment up 0.7% and cut GDP growth by 1%.   Federal spending in 2011 was $3.753 trillion of which $1.233 trillion, the spending for goods and services, was added to GDP.  Transfers, e.g., Social Security and interest on the debt do not add to GDP, only if they are used for private spending.  Two thirds of Federal spending for goods and services, $835 billion, was for national defense.  If, as seems probable, cutting that spending will cut GDP growth and employment, the opposite, increasing that spending, should increase economic growth and employment.

It would not be productive to stockpile more weapons or borrow more money to wage wars in Afghanistan and elsewhere, but there are productive alternatives, investments in the same class as President Eisenhower’s 1956 National Interstate and Defense Highways Act and his 1958 National Defense Education Act in response to the Soviet Union’s Sputnik launch.    We are now under-investing in transportation infrastructure and education, greatly so relative to China, Singapore and others, but our greatest vulnerability is availability and cost of energy.  Failing to address that will make our defense impossible.  Fixing it will have great competitive benefit.

The Department of Energy funded a recently published detailed analysis of the extent to which renewable energy supply can meet US needs over the next several decades.  Its most key finding is:  “Renewable electricity generation from technologies that are commercially available today, in combination with a more flexible electric system, is more than adequate to supply 80% of total U.S. electricity generation in 2050 while meeting electricity demand on an hourly basis in every region of the country.”  See: http://www.nrel.gov/analysis/re_futures/

This means we can eliminate our greatest vulnerability, which could happen soon, e.g., by Iran blocking the Gulf, and must happen when the wells run dry, and by doing it first we would create an enormous global market for our solution.  Why would we not not work with utmost urgency to achieve that?  Enough money is available for the private sector’s share of the investment and the Fed would create more if required.  The US government would have to take on additional debt to fund its share but there would be no problem selling the bonds because the US is already considered the least unsafe borrower.  This investment program would be viewed positively, unlike the existing structural budget deficit and it’s the perfect time for such an investment because borrowing costs are so low.

But we cannot do this with a Congress that will not take action, a President whose leadership does not compel action, and a citizenry that does not understand what to demand.

For much more detail on monetary theory and what the Fed and other nations’ central banks do and why, see my earlier post at:

Can Monetary Policy Reverse our Economic Decline?

Socially Acceptable Healthcare

We have in the USA universal access to medical treatment via the most costly system possible.  What we need is a socially acceptable level of healthcare for all with a way for those who can pay more to get more.

Everyone on US soil regardless of citizenship has the right to medical treatment defined by the Emergency Medical Treatment and Active Labor Act (EMTALA) passed under President Reagan.  A frequently quoted court judgment about it says:  “The Emergency Act was passed in 1986 amid growing concern over the availability of emergency health care services to the poor and uninsured. The statute was designed principally to address the problem of “patient dumping,” whereby hospital emergency rooms deny uninsured patients the same treatment provided paying patients, either by refusing care outright or by transferring uninsured patients to other facilities. Reports of patient dumping rose in the 1980s, as hospitals, generally unencumbered by any state law duty to treat, faced new cost containment pressures combined with growing numbers of uninsured and underinsured patients. Congress responded with the Emergency Act, which imposes on Medicare-provider hospitals a duty to afford medical screening and stabilizing treatment to any patient who seeks care in a hospital emergency room.”

Since essentially all hospitals are Medicare providers, EMTALA in effect mandates that anyone who comes to a medical emergency department must be examined and, if suffering from an “emergency medical condition”, provided with treatment.  A pregnant woman in active labor, for example, must be admitted and treated until delivery is completed.  We treat everyone regardless whether they can pay but only after they need the most costly treatment.  Our cockamamie approach means hospitals must recover the cost of treating those who cannot pay via higher prices for those who do.

Medical insurance in the US is a significant burden on US employers who provide it, a burden their competitors do not bear.  In 1986 we decided to no longer accept that many Americans were being denied treatment for a medical emergency, but we have yet to face up to the competitive issue.

We need all Americans to be productive.  Getting everyone to want to be productive must also be addressed but that is outside the scope of this post.  To be productive you must be healthy, which means you must have access to healthcare.  Since some treatments are extremely expensive and everyone is at risk of needing them, insurance is necessary for all.  Because most people will not in fact need the most costly treatments, universal insurance has the lowest per capita cost.  We currently insure only those over 65 years of age and to a lesser extent those with a serious health issue who cannot afford treatment, i.e., only the most costly to insure.

We need our health care costs to be affordable.  We currently have no defined limits on what treatment will be supplied yet ever advancing technology makes what can be attempted to prolong deeply and irreversibly impaired life astronomically costly.  Who should get what level of treatment is a value judgment we avoid discussing.  We should debate openly what judgments about treatment we want in our society.

There is, however, no disagreement that we want the finest possible healthcare.  That means those who can pay for the best should be able to do so, and the best should be affordable by as many as possible so as to maximize its supply in our society.  If great healthcare isn’t available affordably within our system, we will increasingly go to other countries for treatment.

So what in the end does “socially acceptable” mean?  It implies a level of rationing we agree is OK at a cost we agree is OK.  Achieving that balance is among the most difficult of all challenges.  We will get nowhere until we accept that a balance is necessary.

Capitalists and Other Psychopaths

A recent piece in the New York Times, “Capitalists and Other Psychopaths”, achieves lift-off from: “4% of a sample of corporate managers met a clinical threshold for being labeled psychopaths, compared with 1% for the overall population”.  Buried in this horse-shit are a pony the author points to and a horse he overlooks.

The horse-shit:  An earlier version of the piece said 10% of people who work on Wall Street are clinical psychopaths.  It also failed to note the study’s disclaimer that the sample, 203 corporate professionals, was not representative.  The writer had a conclusion and failed to respect the data.  The sample is both not representative and too small – 1% of 203 is only two people.  What he wanted to say is the statistics are unsurprising because “Wall Street is capitalism in its purest form, and capitalism is predicated on bad behavior”.  He offers a jumble of factual examples – accounting frauds, environmental damage and so on – that also fail to support his conclusion.  Frauds are crimes.  Crimes are not unique to capitalism but occur in every part of every society.  Environmental damages are market externalities (e.g. pollution costs the public not the polluter so it must be regulated).  Capitalism, like every other system, does not resolve every issue for any society.

The pony:  The writer’s anger about “so-called job creators who deserve our gratitude not our envy” leads him to some very important points for tax policy:

  • Entrepreneurs use wealth to create jobs for workers, workers use labor to create wealth for entrepreneurs
  • Neither party aims to benefit the other but both do gain from the exchange
  • Most of the rich are not entrepreneurs.  They are executives of established corporations or people who inherited money

The horse:  It may not be 1% but psychopaths are plentiful at every level of society.  This writer is angered by rich ones, others by poor ones.  This writer admires moms who single-handedly support themselves and raise good kids.  Others focus on successful entrepreneurs who become philanthropists or those born with nothing who never take a handout.  We see demons, “Fatcat CEOs”, “Welfare Queens” and such, and heroes, “Job-creating Investors”, “Fingers-Worked-To-The-Bone Grandparents” and so on.  Demons and heroes do manifest reality, that’s why they have power, but all they do is point out aspects of reality.  Our job is not to hate or worship them.  We must get past the entertainment they provide and take the indicated actions.

It really doesn’t matter if 4% or some other percentage of the 1% who have most of the wealth in our society are psychopaths, or if 1% or some other percentage of the other 99% are psychopaths.  Every society always has been sprinkled with psychopaths.  Cultures throughout the world and from the dawn of history have depended on an ethic of reciprocity expressed as a Golden Rule, “treat others as you would like to be treated” and Silver Rule, “do not treat others in ways you would not like to be treated”.  Behavior according to those rules is self-reinforcing.  It works automatically in all people blessed with empathy.  But societies must legislate and enforce the Silver Rule because it does not work for psychopaths who by definition lack empathy.

In the same way, while Adam Smith’s great insight that free markets work automatically means the “invisible hand” should be allowed to work its magic, regulation is necessary for market externalities and those regulations must be enforced.

Tax Rates and Employment Rates

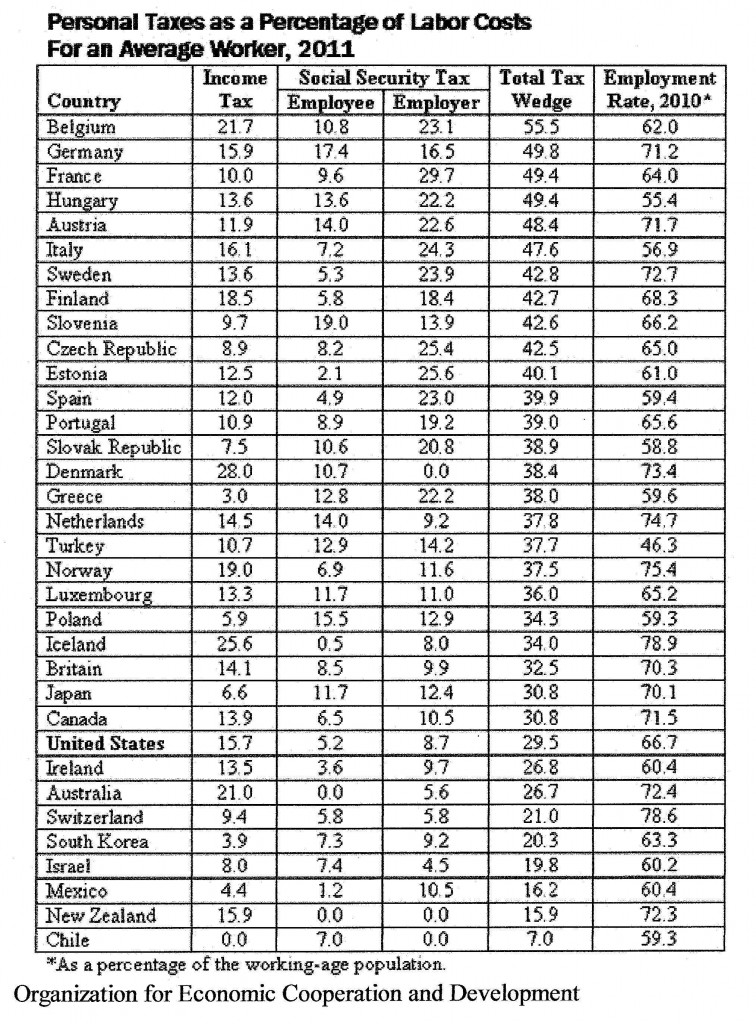
Many in Congress are pledged never to raise taxes.  They say we must, in fact, further cut the “tax wedge”, the difference between an employer’s cost for a worker and the employee’s after-tax reward.  The tax wedge grows when taxes go up so it costs more to employ workers at a given after-tax wage.  If taxes go down, it costs less to employ workers at the same after-tax wage.  That means to cut unemployment we should cut taxes, right?

New data from the Organization for Economic Cooperation and Development (OECD) show there is in fact no correlation between size of tax wedge and rate of employment.

The USA is a low-tax country with a tax wedge of 29.5%.  Three-quarters of OECD countries have a larger tax wedge on average workers.  The data in the last column is workers employed as a % of the working-age population, a better indicator of labor market health than unemployment rate, which fluctuates for many reasons and is counted in many ways.

Key take-aways:  Almost half the countries with a bigger tax wedge employ a larger percentage of their working-age populations than the USA.  More than half of those with a smaller tax wedge have lower employment ratios.

Hat-tip to Bruce Bartlett who held senior policy roles in the Reagan and George H.W. Bush administrations and served on the staffs of Representatives Jack Kemp and Ron Paul.  He concludes http://economix.blogs.nytimes.com/2012/05/01/taxes-and-employment/ by saying: “There is simply no evidence that cutting taxes at the present time will do anything to raise employment.”


USA Government’s Topmost Challenges

The 2012 election is no more than a 24/7 entertainment program.  It distracts us from our government’s most important challenges:

  • Manage public spending
  • Manage the financial sector
  • Eliminate government corruption.

Manage public spending includes:

  • Ongoingly raise sufficient revenue to cover the cost of ongoing services, e.g. the military
  • Issue debt to fund infrastructure investments that can only be made by the public sector, e.g., the interstate highway system
  • Increase taxes to fund large unforseen expenses, e.g. wars

Fundamentally, it means MANAGING the top and bottom lines, not letting them drift.  It does not mean managing them to an ongoing level.  The electorate can change what services are publicly provided.  Infrastructure investment should vary as opportunities (and threats) arise.  Public spending must be managed in the context of national strategy, which will change. The mess we’re in now requires a turn-around plan.

Manage the financial sector includes:

  • Prevent private financial institutions from taking risks insured by the public, e.g. dismantle the TBTF banks
  • Prosecute finance executives who broke existing laws
  • Regulate the derivatives and other currently unregulated markets

Dodd-Frank etc will not prevent another collapse triggered by financial executives who will be made whole by a traumatized public.

Eliminate government corruption includes:

  • Eliminate political influence via campaign contributions

Arguably, this is the most important of all “to-do’s” because good governance is paramount no matter which direction we want to go.  Public spending is not being managed because our governing body is corrupt.  There has been no meaningful reform of our financial sector for the same reason.  Elected representatives should represent all constituents, not favor those who contribute to their election, i.e., we want the reality of one person one vote.

There will always be a spectrum of opinion about matters of culture.  I have opinions about those but they’re not on my list because I do not expect everyone to agree.  I do believe everyone will agree with the 3 “to-do’s” above although not necessarily their relative importance or even that they are the most important three.   What do you say?