Assessing the fairness of property taxes raises issues beyond perceived and actual fairness. We must also start to explore the balance between local and centrally collected taxes, the economic impact of different taxes, and the optimum structure of the entire tax system.
The existing structure: Income tax is levied chiefly at the federal level and is the primary source of funds to support federal spending, sales tax is the greatest source of state government revenue, and local government is funded chiefly by property tax. Personal and corporate income taxes for FY 2013 totaled $2,078B (see What we Tax). The federal government collected $1,707B of that but an additional $334B was collected by the states plus $37B at the local level. Income tax at 37% of the total is by far the greatest source of overall government revenue.
Several sources of tax each account for around 2.5% of the total. Corporate income taxes totaling $399B collected mainly at the federal level is one. $334B of personal plus corporate income tax collected by the states is another. Total sales taxes of $416B is a third, $321B of which was collected by the states. Property taxes totaling $383B is a fourth, almost all of which ($370B) was collected at the local level. The next largest contributor at $152B (setting aside social security contributions better thought of as insurance payments) is utility and liquor store taxes, which are also a form of sales taxes collected chiefly at the local level.
Relative perceived fairness of taxes: Property taxes at 25% take third place in the “not at all fair” stakes and get the highest of all “somewhat unfair” rating at 30%. Page 21 of the poll results I referenced in The Purpose and Performance of our Tax System shows estate taxes to be considered “not at all fair” by 38%, gas taxes and corporate income taxes by 29%, local property taxes by 25%, motor vehicle taxes by 21%, cigarette, beer and wine taxes by 20%, state income taxes by 19%, social security and federal income taxes by 18% and retail sales taxes by 15%.
In the fairness of estate taxes I found them to be among the fairest and most efficient of all. In the fairness of corporate income taxes I speculated they may be better eliminated. What about property taxes?
Property tax issues: Property taxes might fall disproportionately on pensioners and others with relatively high value assets but relatively low income. In response, many local governments provide “homestead exemptions” to reduce the tax on an individual’s home relative to second homes and investment property. There are also exemptions for veterans. Another category getting exemptions is religious institutions. Finally, exemptions are frequently offered as an incentive for businesses to locate within a jurisdiction.
A big reason property taxes are felt to be unfair is they are relatively painful to pay. They are typically collected in two annual installments, so the amount due is large and paying it requires action. The least unpopular tax, retail sales, by contrast is mostly collected in small amounts and automatically.
Property taxes support local education, police and fire protection, and most local infrastructure. Big spending in any of these areas can lead taxpayers to feel spending is out of control and they may revolt. The most common complaint is about spending on education.
Proposition 13 passed 35 years ago that cut and capped property taxes in California was triggered by a change in education spending. A lawsuit complained California’s way of funding public education “fails to meet the requirements of the equal protection clause of the 14th Amendment … [so some taxpayers] are required to pay a higher tax rate than [those] in many other school districts in order to obtain for their children the same or lesser educational opportunities afforded children in those other districts.” The state Supreme Court agreed and equalized per-pupil school spending throughout the state. Prop 13 was the response. Higher than average taxes in wealthy communities no longer provided extra benefit to their children.
The main result of Prop 13 was the state became responsible for what local governments, because their tax revenues were lower, could no longer fund. Decisions about tax increases and how the money will be used that were made locally are now made by the state. What did not change was that California was before Prop 13 and still is now the fourth most heavily taxed state. Incomes are now taxed more heavily than property.
That result and non-result of Prop 13 raise two questions. Is central decision-making more or less fair? Is California’s new tax structure more or less effective?
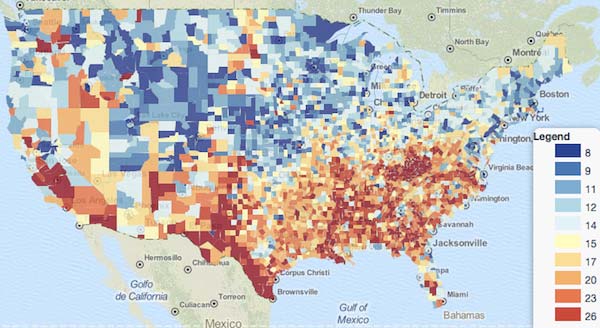
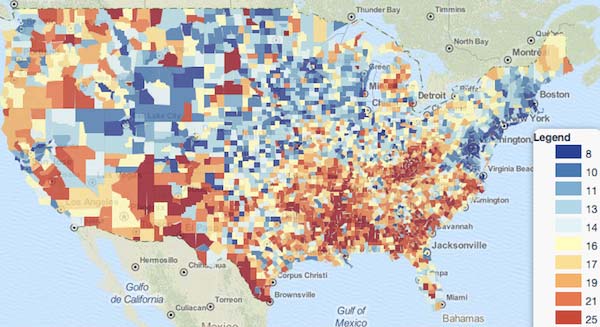
Equal opportunity: What we mean by fairness in this context is a relatively equal opportunity to support ourselves and if we want to work for it, to become wealthy. That is why the California Supreme Court equalized per-pupil spending. Maps based on Census Bureau data at this link illustrate the rationale.
Those who do not graduate from High School are much more likely to live below the poverty line. Unfortunately, I do not have the results of 35 years of central vs local decisions about education spending in California. The map shows there are still great differences in results among localities there. The big message from the maps is the disparity between Northern and Southern states.
Population over 25 without High School Diploma
The much larger percentage of people without a High School diploma in the South and the correspondingly greater percentage of people living below the poverty line suggests we must enhance educational opportunity and expectations in the South as an important part of providing a more equal opportunity for all Americans to succeed. That means a shift in decision-making not just from localities to states but also from states to the federal level.
Population Living below Poverty Line
Growth friendliness: The second question raised by Prop 13 is whether the new tax structure (lower property taxes and correspondingly higher income taxes) is more or less effective for the overall economy. That question is better answered with a larger sample of data.
This report analyzes how tax structures affected economic growth in 21 OECD countries over the last 35 years. The results are: “Property taxes, and particularly recurrent taxes on immovable property, seem to be the most growth-friendly, followed by consumption taxes and then by personal income taxes. Corporate income taxes appear to have the most negative effect on GDP per capita. … These findings suggest that a revenue-neutral growth-oriented tax reform would be to shift part of the revenue base towards recurrent property and consumption taxes and away from income taxes, especially corporate taxes. There is also evidence of a negative relationship between the progressivity of personal income taxes and growth.”
I will consider this information again in posts about consumption taxes, personal incomes taxes and a better overall tax structure and budget management system.
Conclusion: The OECD analysis does not address whether property taxes are more or less fair than other taxes but it does indicate that we would get higher economic growth if property taxes generated a larger part of overall tax revenue. Higher economic growth would facilitate investment to provide more equal opportunity throughout society. This suggests property taxes could be fair and effective if collected and invested not at the local but the federal level.


Some excellent feedback last night made me realize I need to think more about:
(1) Fairness. In this post I wrote: “What we mean by fairness in this context is a relatively equal opportunity to support ourselves and if we want to work for it, to become wealthy.” Adding “support ourselves” raises questions of what government should do with the revenue it collects, especially because I went on to write about education. Equal access to education of equal quality is one of the requirements, but it’s outside the scope of this topic. Other out-of-scope “support ourselves” topics include how to support ourselves when we don’t work because we retired, lost our job, or are unable to work.
(2) Spending. My aim in this post was only an initial exploration of the fairness, effectiveness and side-effects of property tax as a source of government revenue. By including what I did about education, I strayed into spending, which I want to address separately. I will post a separate series on areas of spending by various levels of government, how much is spent and how much we want spent.
(3) Transition. This series of posts must conclude with not just the structure of a fairer tax system but a fair way to transition to it from what we have now. For several years in Maine, for example, locally collected property taxes were sent to the State government then redistributed throughout the state on a per-pupil basis. Educational results improved but communities paying high property taxes got the system overturned. As in California, those who paid above-average property tax considered it unfair that their community should get only average benefits. Schools are now chiefly funded at the local level. Presumably, the result will be increasingly different educational results from community to community.
The other big change is because less funds for education flow from the federal to the state level, less from flows from states to localities, so either local schools must cut spending, property owners must pay more, or both. The first budget proposed for the upcoming year in my town, for example, would have raised property taxes by more than 12%. Nobody considered that acceptable but many also object to the school spending cuts that are the only way to get to a significantly lower tax increase.
(4) Education. I’ll add it as a high level topic along with healthcare and defense. There are already one or two posts on education but it needs to be addressed holistically. How much we should spend on education and how we should distribute the spending is one thing, how to get better results is the critical issue.
Finally, while the OECD research referenced near the end of this post reports that property and consumption taxes are the most growth friendly, that does not necessarily mean they are the best sources of government revenue nor does it tell us at which level of government they are best collected. The structure of the existing tax system reflects practical constraints on collection that existed before the widespread establishment of now information technologies.