
I’ve come to think of charts like the ones in this post as cave paintings. We must study them carefully to see what they reveal and also what their structural assumptions obscure.
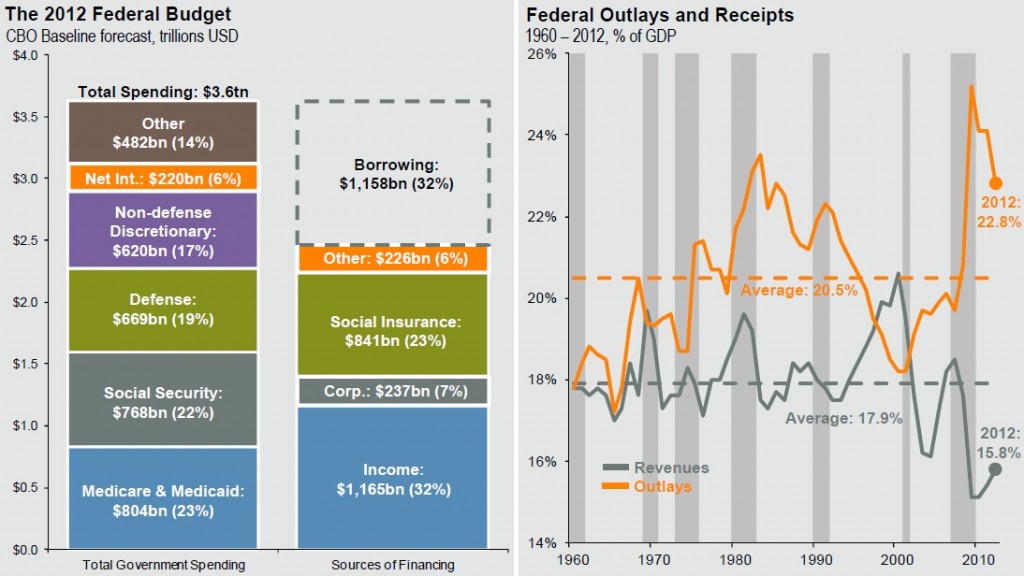
The bar chart shows we are financing an enormous amount of Federal spending with borrowing – almost one third. The line chart shows we spent more than revenue for most of the last half century and why the current imbalance is so enormous – the Great Recession. As in previous recessions (indicated by darker bars), revenue fell starting in 2007/8 because incomes fell, and spending increased because unemployment increased.
The line chart also shows revenue now heading up and spending down as in most post-recessionary times. But here we start to wonder what we’re measuring. It doesn’t feel like we’re out of recession. Corporate profits are at an all-time high, the unemployment rate is a bit lower, it’s good news federal revenue and spending are heading in the right direction, but we don’t feel good.
The line chart also raises a question. Spending fell after the early ’80s and early ’90s recessions. Why did it increase before the most recent recession? Largely because of a very costly unfunded new program initiated at that time, the War on Terror.
The bar chart shows only a little of what we need to understand. A commercial enterprise with multiple lines of business (LOB) reviews each LOB’s revenue and spending individually. This chart shows, or seems to show that for only a single Federal program, Social Security. Since Social Insurance revenue at $841B is greater than Social Security spending at $768B, it looks to be in good shape. But does what’s labelled “Social Insurance” revenue include Medicare as well as Social Security payroll tax?
Additional research would show that Social Security revenue is in fact greater than spending. Digging deeper would show when that will reverse as well as the past and potential effects of adjusting the formulas that govern its revenue and spending. As I noted in a previous post, it would, for example, show that raising the maximum wage on which S/Sec tax is withheld to its traditional real level would eliminate half the future imbalance.
The bar chart shows that the Federal Government’s borrowing costs at 6% of the total are relatively affordable at this time. It also shows they will not be so if total spending continues to exceed revenue by such a wide margin, currently 32%. We added $1,158B to our total debt in 2012 on which we paid $220B interest.
Questions the charts provokes but does not illuminate include:
- Why is Medicare/Medicaid spending so high at $804B and 23% of total spending, how much is its revenue, how can they be balanced?
- Why is Defense spending so high at $669B and 19% of total spending, how and by how much should it be cut?
- What makes up Non-Defense Discretionary Spending, are we over- or under-spending there?
- What makes up “Other” spending, are we over- or under-spending on elements of that?
- How can we best increase revenue to pay for spending we choose not to eliminate?
- Can we fix the federal spending/revenue imbalance with economic growth?
The next chart suggests the possibility of a positive answer to question 6. Since our real economic growth in the most recent decade was at by far its lowest rate since the decade of the Great Depression, after which it grew rapidly, we could hope that experience will be repeated.
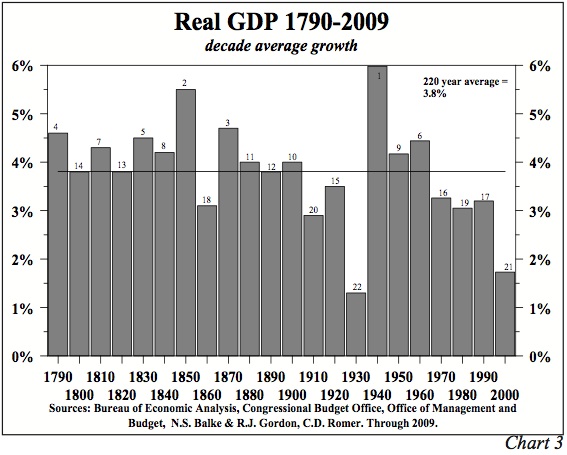
The primary drivers of post-Great Depression GDP growth were spending on WW2 and on post-WW2 recovery programs including the GI Bill and mortgage subsidies. Fortunately, WW3 seems unlikely in the near future so we need other ways to increase economic activity. We must also answer at least the first two questions above, healthcare and defense costs. The data is visible in cave paintings down those mine-shafts so we’ll take a flashlight and calculator as well as a canary to investigate.