
Our tax system is a lot like Topsy in “Uncle Tom’s Cabin”, who says: “I s’pect I growed. Don’t think nobody never made me.” It growed item by item, legislative session by session, with no defined goal. What if we had a tax goal and a budget management plan?
This is the first in a series of posts about our current system and its results. What can be taxed falls into these major categories:
- Income, what people and corporations earn (e.g., income tax, social insurance programs)
- Wealth, what people own (e.g., annual real estate tax, inheritance tax)
- Consumption, what people buy (e.g., sales tax added to restaurant bill or embedded in gas price, value added tax paid at each step from raw materials through manufacturing and retail to end user)
- Usage of public goods (e.g., road and bridge tolls)
- Financial transactions (e.g., stock sales)
Our current system is complex for both structural and political reasons. We have three levels of government, each of which must fund its spending. That’s the structural cause. Politics is far greater. Politicians legislate what revenue will be collected, e.g., income tax rates, and what will not, which they call tax preferences. They are popular while increases are not, and they can at the last minute be attached without debate to other legislation. No wonder we have so many – the Federal tax code alone grew in the past 10 years from 1.4M to 3.8M words.
Mistakes and cheating are inevitable with such a system. And complexity leads to high costs. The IRS estimates taxpayers and businesses spent over 6B hours in 2008 complying with filing requirements, the equivalent of 3M workers who would have been paid $163B. That would have been 11% of total 2008 Federal tax revenue.
How much do we currently tax at each level of government? The following data (unfortunately structured a little differently from my categories above) comes from this excellent site:
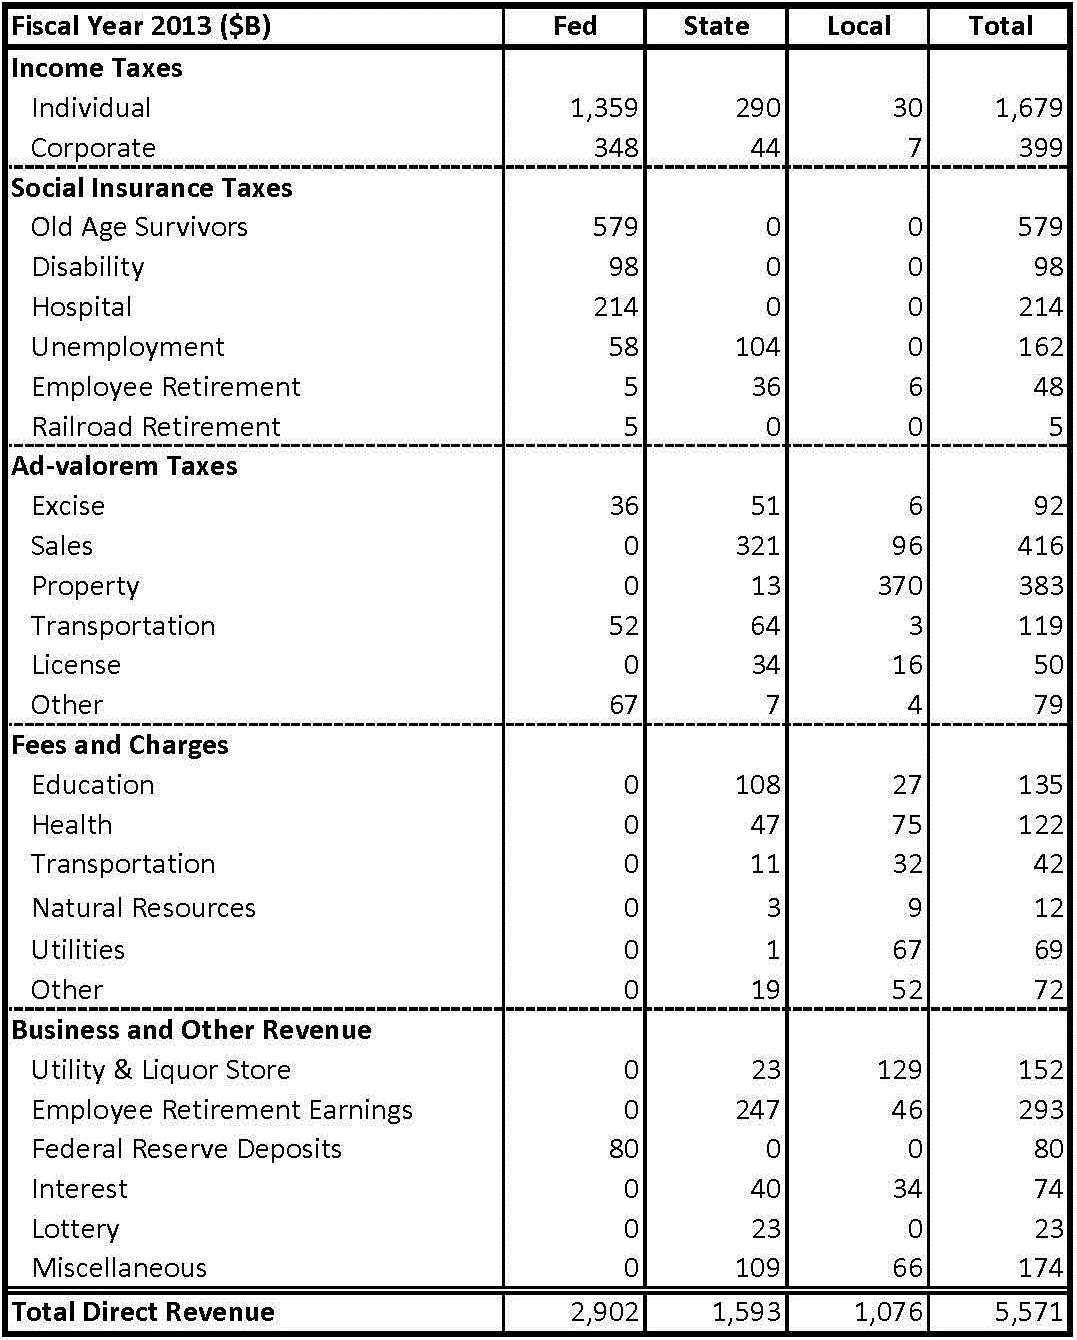
Total tax revenue for 2013 is expected to be around $5.6T, 52% of which or $2.9T will be Federal, 29% or $1.6T State, and 19% or $1.1T Local taxes. Less than a third (30%) of the total will be $1.7T of individual income tax, 80% of which will be Federal. Corporate income tax at $399B will be only 7% of the total. Social insurance taxes totaling $1.1T will be 20% of the overall total. Another 20%, $1.14T, will be “ad valorem”, i.e., real estate and personal property tax, sales tax, inheritance tax, etc. levied chiefly by State and Local governments.
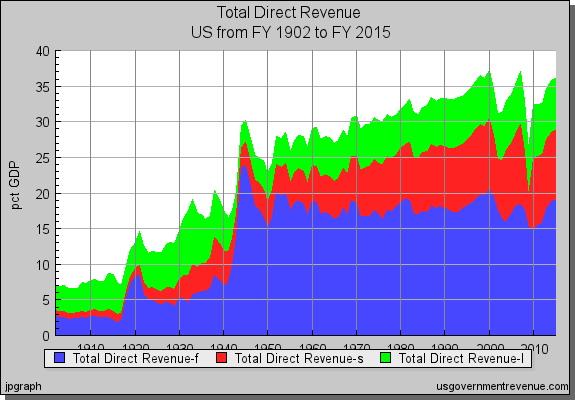
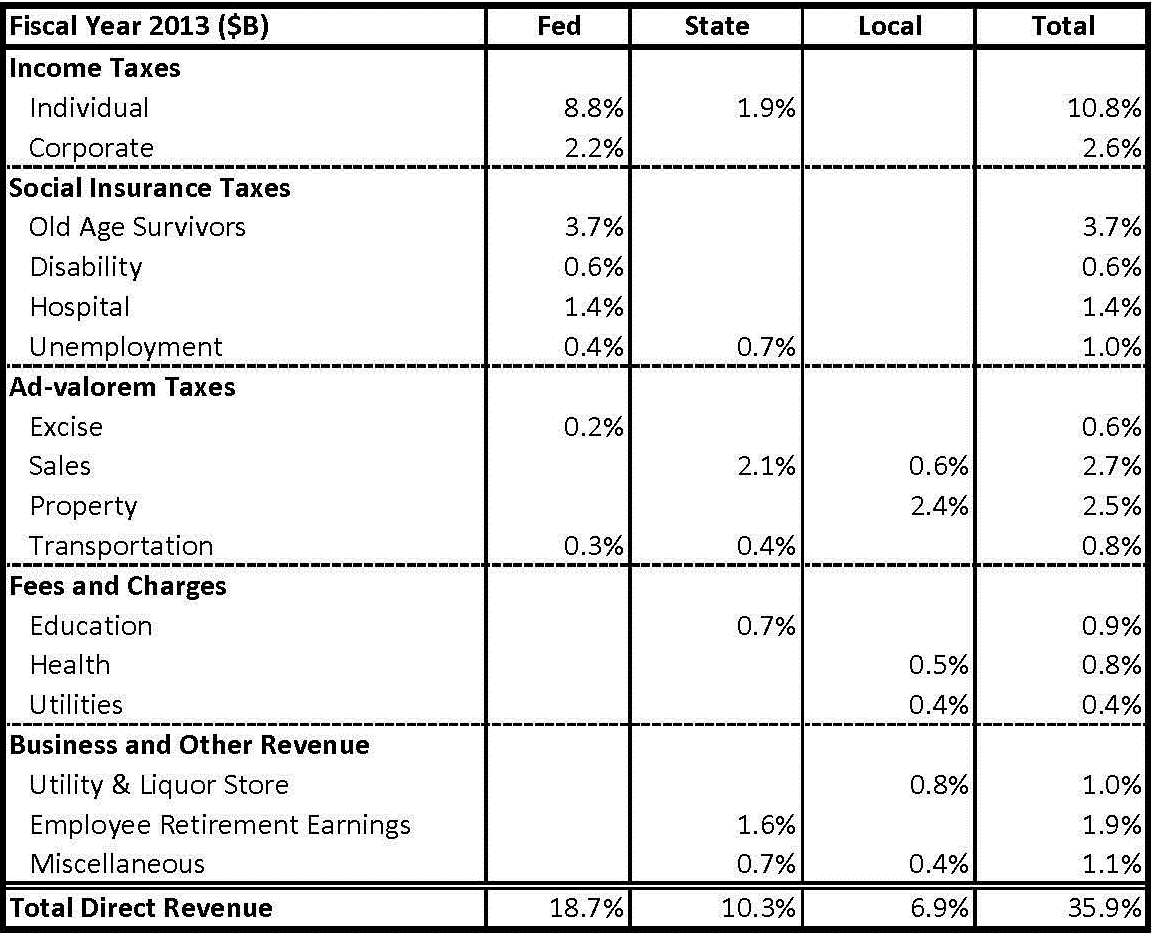
These charts make it easier to see what taxes are collected by each level of government.


How has tax changed over time? Total government revenue grew from 7% of GDP at the start of the 20th century to 36% now, about where it was in 2000. At the start of the 20th century Federal tax was 3%, State 1% and Local 4% of GDP. Driven by WW1, Federal spiked to 8% and total revenue to 15% of GDP, then Federal dropped back to around 5% through the ’20s. The Great Depression drove total tax back up to 19% in 1933, of which 6% was Federal, 4% State and 9% Local. WW2 drove a huge spike to 30% of GDP in 1945, dominated by Federal at 24%. Federal dropped to 16% of GDP by 1950, jumped to 20% in the Korean War and stayed mostly in the high teens since then. State revenue hit 8% in the 1982 recession and now fluctuates between 8% and 10%. Local revenue hit 6% in 1982 and now fluctuates between 6% and 8%.
What was taxed also changed. At the start of the 20th century the Federal government got its revenue chiefly from import tariffs while State and Local governments levied property taxes. Income tax was established in 1913. It went to 5% of GDP following WW1, settled around 2% through most of the ’20s and ’30s, spiked to 16% in 1944 and settled between 11% and 12% thereafter. Sales and other point-of-transaction taxes doubled from 5% or 6% at the start of the 20th century, peaked in the Great Depression at 14% then dropped to 10% by 1960 and 7% now. Fees and charges grew slowly to 1% until WW2 then faster to 3% now. Social insurance taxes established in 1937 to fund Social Security were less than 1% in the first year, grew to around 10% in the 1980s and are now 6% to 7% of GDP.
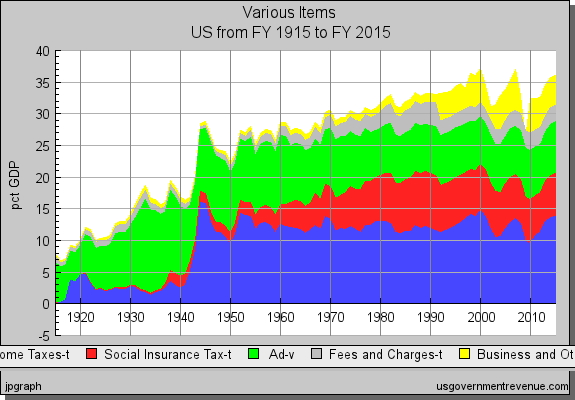
Federal revenue is now chiefly from income and social insurance taxes. State revenue was mainly ad valorem until the ’70s although they began collecting income tax in the ’20s and social insurance in the ’30s. It is now about equal thirds income tax, ad valorem, and fees plus business and other revenue (56% of which is earnings on pension investments). State income taxes rose sharply in the ’70s and ’80s, then flattened. Local revenue is about half ad valorem taxes, half fees plus business and other revenue (40% of which is from water and electric utilities).
Now we know what we tax and how it changed in the past century we can in the next couple of posts see who pays what % of the total and what taxes we intentionally do not collect.
Highlights so far include:
- Total tax grew steadily as a % of GDP for half a century following WW2
- Total tax peaked in 2000 and is now at the same level but it has twice fallen very sharply
- Almost half of all tax revenue is collected by State and Local governments
- Less than a third of the total is personal income tax
- Income tax has been quite steady around 13% of GDP since WW2
- Sales and property taxes are around the same level as corporate income taxes
- Social insurance tax is pretty steady at 6% to 7% of GDP (but health care spending is fast increasing)