Property Tax and Fairness

Assessing the fairness of property taxes raises issues beyond perceived and actual fairness.  We must also start to explore the balance between local and centrally collected taxes, the economic impact of different taxes, and the optimum structure of the entire tax system.

The existing structure:  Income tax is levied chiefly at the federal level and is the primary source of funds to support federal spending, sales tax is the greatest source of state government revenue, and local government is funded chiefly by property tax.  Personal and corporate income taxes for FY 2013 totaled $2,078B (see What we Tax).  The federal government collected $1,707B of that but an additional $334B was collected by the states plus $37B at the local level.  Income tax at 37% of the total is by far the greatest source of overall government revenue.

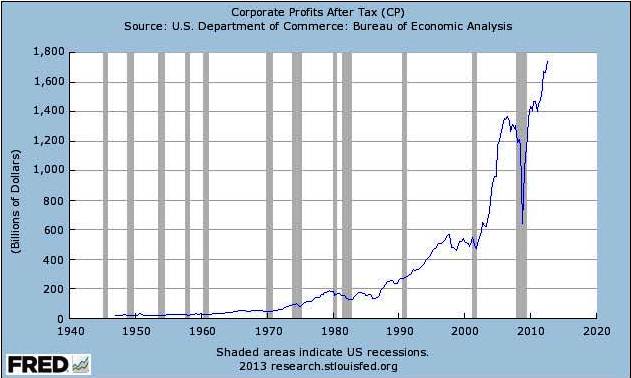
Several sources of tax each account for around 2.5% of the total.  Corporate income taxes totaling $399B collected mainly at the federal level is one.  $334B of personal plus corporate income tax collected by the states is another.  Total sales taxes of $416B is a third, $321B of which was collected by the states.  Property taxes totaling $383B is a fourth, almost all of which ($370B) was collected at the local level.  The next largest contributor at $152B (setting aside social security contributions better thought of as insurance payments) is utility and liquor store taxes, which are also a form of sales taxes collected chiefly at the local level.

Relative perceived fairness of taxes:  Property taxes at 25% take third place in the “not at all fair” stakes and get the highest of all “somewhat unfair” rating at 30%.  Page 21 of the poll results I referenced in The Purpose and Performance of our Tax System shows estate taxes to be considered “not at all fair” by 38%, gas taxes and corporate income taxes by 29%, local property taxes by 25%, motor vehicle taxes by 21%, cigarette, beer and wine taxes by 20%, state income taxes by 19%, social security and federal income taxes by 18% and retail sales taxes by 15%.

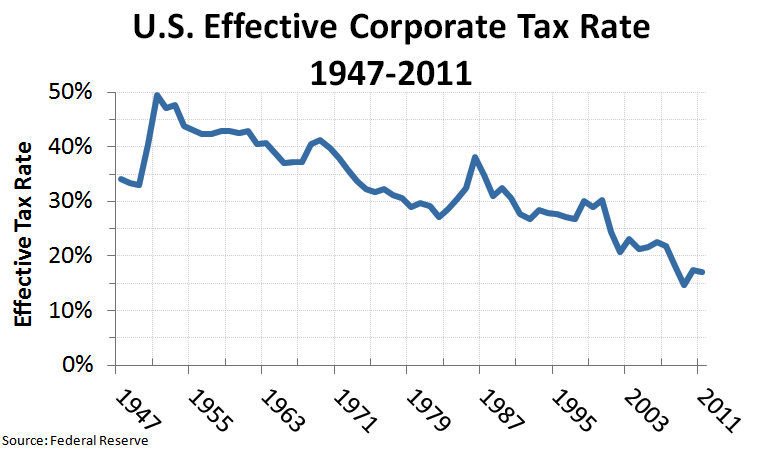
In the fairness of estate taxes I found them to be among the fairest and most efficient of all.  In the fairness of corporate income taxes I speculated they may be better eliminated.  What about property taxes?

Property tax issues:  Property taxes might fall disproportionately on pensioners and others with relatively high value assets but relatively low income.  In response, many local governments provide “homestead exemptions” to reduce the tax on an individual’s home relative to second homes and investment property.  There are also exemptions for veterans.  Another category getting exemptions is religious institutions.  Finally, exemptions are frequently offered as an incentive for businesses to locate within a jurisdiction.

A big reason property taxes are felt to be unfair is they are relatively painful to pay.  They are typically collected in two annual installments, so the amount due is large and paying it requires action.  The least unpopular tax, retail sales, by contrast is mostly collected in small amounts and automatically.

Property taxes support local education, police and fire protection, and most local infrastructure.  Big spending in any of these areas can lead taxpayers to feel spending is out of control and they may revolt.  The most common complaint is about spending on education.

Proposition 13 passed 35 years ago that cut and capped property taxes in California was triggered by a change in education spending.   A lawsuit complained California’s way of funding public education “fails to meet the requirements of the equal protection clause of the 14th Amendment … [so some taxpayers] are required to pay a higher tax rate than [those] in many other school districts in order to obtain for their children the same or lesser educational opportunities afforded children in those other districts.”   The state Supreme Court agreed and equalized per-pupil school spending throughout the state.  Prop 13 was the response.  Higher than average taxes in wealthy communities no longer provided extra benefit to their children.

The main result of Prop 13 was the state became responsible for what local governments, because their tax revenues were lower, could no longer fund.  Decisions about tax increases and how the money will be used that were made locally are now made by the state.  What did not change was that California was before Prop 13 and still is now the fourth most heavily taxed state.  Incomes are now taxed more heavily than property.

That result and non-result of Prop 13 raise two questions.  Is central decision-making more or less fair?  Is California’s new tax structure more or less effective?

Equal opportunity:  What we mean by fairness in this context is a relatively equal opportunity to support ourselves and if we want to work for it, to become wealthy.  That is why the California Supreme Court equalized per-pupil spending.  Maps based on Census Bureau data at this link illustrate the rationale.

Those who do not graduate from High School are much more likely to live below the poverty line.  Unfortunately, I do not have the results of 35 years of central vs local decisions about education spending in California.  The map shows there are still great differences in results among localities there.  The big message from the maps is the disparity between Northern and Southern states.

Population over 25 without High School Diploma

Population over 25 without high school diploma

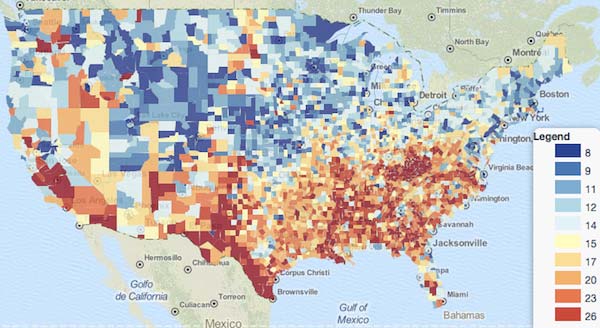
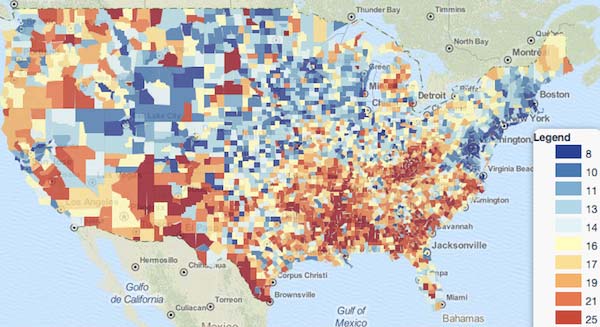
The much larger percentage of people without a High School diploma in the South and the correspondingly greater percentage of people living below the poverty line suggests we must enhance educational opportunity and expectations in the South as an important part of providing a more equal opportunity for all Americans to succeed.  That means a shift in decision-making not just from localities to states but also from states to the federal level.

Population Living below Poverty Line

Population below poverty line

Growth friendliness:  The second question raised by Prop 13 is whether the new tax structure (lower property taxes and correspondingly higher income taxes) is more or less effective for the overall economy.  That question is better answered with a larger sample of data.

This report analyzes how tax structures affected economic growth in 21 OECD countries over the last 35 years.  The results are:  “Property taxes, and particularly recurrent taxes on immovable property, seem to be the most growth-friendly, followed by consumption taxes and then by personal income taxes.  Corporate income taxes appear to have the most negative effect on GDP per capita.  …  These findings suggest that a revenue-neutral growth-oriented tax reform would be to shift part of the revenue base towards recurrent property and consumption taxes and away from income taxes, especially corporate taxes. There is also evidence of a negative relationship between the progressivity of personal income taxes and growth.”

I will consider this information again in posts about consumption taxes, personal incomes taxes and a better overall tax structure and budget management system.

Conclusion:  The OECD analysis does not address whether property taxes are more or less fair than other taxes but it does indicate that we would get higher economic growth if property taxes generated a larger part of overall tax revenue.  Higher economic growth would facilitate investment to provide more equal opportunity throughout society.  This suggests property taxes could be fair and effective if collected and invested not at the local but the federal level.

Corporate Income Tax and Fairness

To get a good tax system we must: (1) know the cost and effects of each tax, (2) know who pays which taxes, and (3) decide which groups will contribute how much of the total.

We first explored estate taxes.  They turned out to be cheap to collect, hard to evade and have low impact on economic activity  Now corporate income taxes.  They are costly to collect, quite easy to avoid or evade, and fraught with competitive issues.  We noted earlier that estate taxes paid by the heirs of those who built the asset are the most unpopular of all.  That suggests we hold the peculiar belief that those who earn money should be taxed while those who inherit what others earned should not.  The Walmart heirs, for example, own more than the bottom 40% of America.  Is that what we want?

In general, we want corporations to pay more income taxes while we pay less.  Taxes are taken directly out of what we earn, so they are highly noticeable.  It feels unfair that a significant amount of our earnings is taken away but corporate income taxes do not feel unfair because we feel corporations could afford more.  When we hear that some pay none at all, it feels outrageously unfair.  It also feels unfair that while we are taxed on gross income, businesses are taxed only on profits.

Who in fact does pay corporate income taxes; customers, workers or owners,?  It can’t be customers because prices are set by the market and the market is supplied not just by corporations but also sole proprietorships, partnerships and S-corporations that pay individual income tax.  That means corporations can’t raise prices to cover their taxes.  So, is it workers or owners?  When corporate income tax was introduced in 1909 it reduced profits, i.e. was paid by shareholders.  Later, it was paid in part by workers getting lower wages.  Treasury Department economists reckon 82% now falls on owners and 18% on labor.

Note that tax on the income of non-incorporated businesses is paid entirely by the owners and, as I noted in Business Tax, around two thirds of US businesses reporting profits of $1 million or more are not incorporated.

How much tax do corporations pay?  The top rate in the US at 39.1% (35% at the federal level) is the highest in the world.  The effective rate, what they actually pay, is less clear.  The Tax Foundation summarizing 13 studies reports rates ranging from 23% to 34.9%.  The US rates are among the five highest for all countries analyzed.  Another analysis found 30 Fortune 500 companies had paid no federal corporate income taxes at all for the 2008-2010 period and there was recent outrage that, by accounting for them overseas, Apple avoided taxes on $74 billion in profits over the last four years.  Less noticed is that Apple’s 14% effective tax rate is much higher than Ford’s 3%, Amazon’s 6%, Boeing’s 7% and Verizon’s 9%, and is in the same range as IBM 15% and Google 17%.  That is half the 29.1% average rate for 2007-2012.  This magnificent chart shows all the numbers.

Why such different rates?  Chiefly because US corporations can delay paying income taxes on overseas profits until they are brought back into the US.  $1.7T of profits is currently estimated to be offshore.  Corporations like Apple locate intellectual property and/or manufacturing in countries with low tax rates.   When an Apple product is sold in the US, Apple pays its patent-holding Irish subsidiary a royalty that reduces the profit Apple shows in the US and transfers it to low-tax Ireland.  Apple borrows in the US, deducts the interest here, and uses the funds to pay dividends to shareholders and establish manufacturing overseas.  PepsiCo relocated concentrate manufacturing from New York to Ireland.  Over half their soda sold worldwide is now based on concentrate manufactured there.  Coca-Cola opened a plant in Singapore to produce concentrate for 18B cans of soda a year.  The soda industry as a result paid not the 29% average tax rate but 19%.  But retailers, who among other things sell soda, cannot relocate offshore so most of them paid between 35% and 40%.  Even Wal-Mart paid 31%.

The closer you look, the more complicated corporate taxes become.  Large multinational corporations have great flexibility in where they locate production, incur costs and realize profits.   They can borrow in one country and take the interest deduction there, locate production facilities and employ workers in another country, and realize profits in a third country.  A change in taxes on overseas profits impacts only multinationals, a change in depreciation allowances mainly affects manufacturing companies, but many multinationals are manufacturers.  The existing tax code encourages moving jobs overseas.

How important is this?  The Joint Committee on Taxation estimates a bill introduced this February by Senator Sanders (I-Vt.), a member of the Senate Budget Committee, would yield more than $590B over the next decade.  US corporations would pay US taxes on all profits when and wherever earned.  “At a time when we have a $16.5 trillion national debt and an unsustainable federal deficit; at a time when roughly one-quarter of the largest corporations in America are paying no federal income taxes; and at a time when corporate profits are at an all-time high, it is past time for corporate America to contribute significantly to deficit reduction”, Sanders said.

By closing the gap between companies that now pay different rates, the bill would also result in the market, not the tax code, playing a bigger role in determining companies’ success and failure. 

Is that the only alternative?  Wouldn’t it price our corporations out of the global market or commit us to cut our corporate tax rate in a global race to the bottom where all countries keep cutting?  Taxes based on where customers are located is another option.  The state of California moved to a sales-based system last year because the States already are in a race to the bottom.  Maine, where I live, is considering a substantial cut in business taxes for this reason.  In California’s scheme, a company that gets 20% of its sales in California pays California taxes on 20% of its worldwide profits at the state’s corporate tax rate.  It makes no difference where the firm has offices or where its employees work.

The US could move to a similar system, though if we were the only nation that did, companies could be taxed twice.  Presumably, there would be changes to our existing tax treaties with countries that require non-US companies to pay tax here while US companies pay tax there.

But could it be there is no system in a global economy that’s fair for multinational vs domestic corporations, small vs large ones, corporations vs non-incorporated, advanced vs developing economies, and so on.  Should we just end corporate income tax?  As I noted in Business Tax, it has long been falling as a % of GDP and as we saw above, it is paid mostly by shareholders.  Since they tend to be wealthier than average, that results in greater income inequality.  It would at least be clearer if we simply decided what rates of tax those with higher and lower incomes should pay.

What to do about corporate income tax?  Eliminate deferral of the tax on profits held overseas and other exemptions while cutting our tax rate?  Switch to taxing worldwide profits based on the US percentage of worldwide sales?  Eliminate corporate income tax?  Or what?  That decision must be made along with decisions about personal income and other taxes, each forming part of a better overall tax system.

The research for this series of posts is proving a lot more interesting than I expected.  We value working for success but want to abolish estate taxes.  What we call “payroll taxes” are not taxes but savings and insurance.  Corporate income tax is paid chiefly by wealthy people, distorts competition and cuts personal income by encouraging jobs to be moved overseas.  What will we discover next?

Social Security Tax and Fairness

Do we really need Social Security?  Is it fair that it is mandatory or that high earners contribute more but get relatively less benefit?   What is the best way to keep it financially sound?  What guidance does it offer to make our overall tax and budget management system better?

Do we need Social Security?  It is different from other government programs in that its costs are matched by dedicated taxes.  Hoping to stimulate consumer spending, we recently cut them temporarily.  Should we eliminate them altogether?  It would be time-consuming and costly, but we could in theory unwind the program and for example, switch to a system like Nepal’s where families traditionally support each other.

That thought experiment highlights the parallel between contemporary Nepal and pre-industrial USA.  Both are family farm economies where when you retire, your kids take over and support you.  In a society where generation after generation works on the same farm, if you are unable to work when your kids are young, a relative can take over and neighbors help when family is not enough.   In an economy of jobs, however, workers create no family asset to take over, people keep moving, families become dispersed and communities exist mainly in virtual space.

Nepal’s situation is thought-provoking, too, because its traditional support system is collapsing.  The 1996-2006 civil war made villages too dangerous so people abandoned their farms and moved to the cities.  They now need jobs but Nepal has no industry because there is insufficient power (no electricity 14 hours a day), insufficient access to market (no railroad and extremely weak roads), a corrupt legal system and no government.  So Nepalis go overseas for jobs and send money to their families.  That is currently a quarter of the entire economy.  But they send less as they form new attachments.

In the USA we have a job-producing infrastructure but we are vulnerable to losing our job, our family is probably far away, and few of us save enough for retirement.  Like other Western societies, the nature of our economy makes us dependent on social security when we cannot support ourselves.

Is it fair that Social Security is mandatory?  It seems so in a society like ours.  We simply don’t save enough voluntarily – 7% or more of every $ we ever earn, invested to earn at least 3% above inflation, as noted here: Our Ridiculous Approach to Retirement.  And we don’t have enough disability insurance.  The result?  “Almost half of middle-class workers, 49 percent, will be poor or near poor in retirement, living on a food budget of about $5 a day”.  That’s even with social security benefits.

Is it fair that high earners contribute more but get the same benefit as those who contribute less?  We all contribute at the same % rate but the higher our income, the more we contribute in total.  The more we contribute, the higher our monthly benefit, but those who contribute more get proportionately less.  We get 90% of the first $X (currently $791) of our average monthly earnings, 32% of the next $Y of earnings (currently the the amount between $791 and $4,768), and 15% of the remaining $X  (currently the amount over $4,768) – see Social Security Benefit Amounts.  Is that fair?

That question may be the most contentious.  Should those with higher earnings pay taxes at the same or a higher rate?  I will return to this when I explore income tax.  Here, I’ll just make an observation in this context.  Everyone’s work adds assets to our economy.  If it is reasonable to consider those with higher earnings to be getting a higher return on those assets, it is reasonable they should contribute more to the ongoing development of the assets.  I can’t be the first to have this thought.  I’d be grateful for a discussion of its merits, if any.

What is the best way to keep Social Security financially sound?  Social Security will take in roughly $40B more than it pays out in 2013, so it is not contributing to the problem I noted in FY2010 Revenues, Expenses and Liabilities: “Federal revenue last year was $2.2T while expenses were $3.5T.  We therefore increased public debt by $1.3T.”  Although the Social Security’s trust fund is growing now and will be around $2.8T in 2013, that will not always be the case.  As I noted in Social Security “Social Security taxes [were sufficient] to pay current recipients … until 1975 – 1981 when expenses exceeded revenue every year.  Average benefits were then cut approx 5%, tax rates for individuals were raised approx 2.3%, and the full retirement age was raised 3%, which created an annual surplus until 2009.”  Another update will be necessary.

“The fundamental problem”, I wrote, “is that while 100 workers supported only 6 Social Security beneficiaries in 1950, 100 workers in 2010 must support 33 beneficiaries.  When the Social Security full retirement age was set at 65 in 1935, USA life expectancy at birth was 62.  The retirement age is now 67 but life expectancy is 78. “  In Social Security – Past and Future Changes I explored our options.

The best way is to increase the payroll tax ceiling and raise the tax rate.  I won’t repeat the analysis here, just add that Social Security finances are far more predictable than other government programs.  We can model population trends, which change relatively slowly, and accurately forecast future spending.  Revenue is relatively stable because contributions are collected automatically and are pre-tax.  Income tax revenue fluctuates more with the economy (and is easier to illegally evade).

What guidance does Social Security offer for a better overall tax and budget management system?  We need better presentation of Federal government finances.  Social Security spending is usually presented in the context of total spending not in relation to its revenues, so we don’t connect the two.  Payroll taxes feel like an onerous burden on every pay check.  Social Security benefits seem like a burden adding to our public debt.  Social Security looks like just one more unfathomably costly activity of an out of control government.

As JohnK commented about an earlier post: “I always grind my teeth when I see social security benefits lumped in as part of our federal budget.  For instance, in your “The Purpose and Performance of Our Tax System” post, you have a pie chart showing Social Security benefits as 22% of the federal budget.  That amount, and others like it, should be lumped under something like ‘Repayment of Borrowed Money’.”  Folks getting Social Security checks are simply getting back contributions they made when they were working, plus the [notional] investment profits.

TonyP commented on another confusing aspect: “I believe it was Al Gore who proposed a “social security lock-box” in order to stop the federal government from looting the social security trust fund to improve cash-flow.”  Social Security contributions are not invested as a regular pension fund would in marketable securities, but are used to fund overall Federal spending.

John replied: “As per the Budget Enforcement Act of 1990, the social security trust funds are NOT a part of the federal budget.  By law, income accrued by the social security trust funds is invested in securities GUARANTEED as to both PRINCIPAL and INTEREST by the full faith and credit of the U. S. Government.  When the government spends the money obtained from these debt obligations or any debt obligations such as Treasury bonds, it is spending “borrowed” money.  When it is required to redeem these securities, the amount redeemed should be labeled something to the effect: “Loan Redemptions” and not “Social Security”. 

So from one perspective, the Social Security trust fund is a fiction because the money put into it has already been spent, but from another, the money is no more fictional than any other ledger entries representing loans.  What was borrowed from the Social Security trust fund is secured by US Treasury bonds that will be repaid.  John added:  “The official SS history is at: http://www.ssa.gov/history/BudgetTreatment.html  Social Security ADMINISTRATION costs are on the federal budget as are administration costs of all federal agencies, but that amount is relatively miniscule, and is not what was represented on Martin’s pie chart.”

Fully absorbing that official history is headache-making but scanning it gives a sense of why presentation is so important.  The way our government finances are presented now makes it impossible for most of us to evaluate what’s going on.  We don’t know where our tax dollars go.  We imagine half is wasted and the other half is spent on things that benefit other people.

In summary:

  1. We do need a Social Security system
  2. It is financially sound but if unchanged it will not remain so
  3. The options to keep it financially sound for at least the medium-term future are not hard to understand
  4. We are easily misled about all the above because Social Security revenues and spending are usually not presented together, and
  5. If Social Security finances were presented more clearly we’d be better able to debate what’s most fair to those contributing now, those needing support, and future generations.

But as I’ve said before: “The greatest challenge is … an accelerating reduction in the number of jobs as more and more is done by computers and robots”.  That could be a much deeper challenge than for Social Security alone so I will return to it at the end of this series.  Next up, Business Tax and Fairness.

Estate Tax and Fairness

What components must a tax and budget management system have to achieve the results we want?   I’ll start with a result and a candidate that illustrate a few large issues.

It seems to me now that what I said was my biggest surprise in this post, Qualities of an Excellent Tax System, should not have been a surprise at all.  The American Dream is that our freedom includes equal opportunities for all of us to achieve prosperity and success.  In that case, it makes sense that nine out of ten of us would say we want a relatively equal distribution of wealth.  What we mean is, we want relatively equal opportunities to become wealthy.

So, the system needs to to, “lead toward the distribution of wealth we democratically choose”.   By “lead toward” I mean propel the wealth distribution on average and over time, and by “democratically choose” I mean the distribution we want could change but it should at all times be in some way explicitly approved by the electorate.

Among the indicated requirements is to diminish, “unfair opportunity based on parental wealth”.  Estate taxes are a potential mechanism.  How much support might there be for them, and how effectively would they support the objective?

Estate taxes would not be popular at all.  The compendium of public opinion research I used for this post about our tax system shows on page 21 the results of a March 2009 Harris poll about the perceived fairness of various kinds of federal and state/local taxes.  Federal estate taxes are considered the least fair of all.  Two in five respondents (42%) consider them “not at all fair”.  Fully two thirds (67%) consider them “somewhat or not at all fair”.

Before exploring if estate taxes could nevertheless be effective, it’s instructive to set their unpopularity in context.  Every form of  tax has high “somewhat or not at all fair” ratings.

At the federal level, the combined “somewhat or not at all fair” ratings for each type of tax are:  estate taxes 67%, gas taxes 63%, personal income taxes 48%, corporate income taxes 42%, social security payroll taxes 40%, and cigarette, beer and wine taxes 36%.  At the state/local level they are: gas taxes 62%, local property taxes 50%, motor vehicle taxes 47%, state income taxes 44%, cigarette, beer and wine taxes 38%, and retail sales taxes 37%.

I’ll come back to those statistics in future posts.  One thing to consider is the seeming paradox that while gas taxes are almost as unpopular as estate taxes, retail sales taxes, which are also levied at point of sale and unlike gas taxes are shown separately and so are more visible, are considered the least unfair of taxes along with those on cigarettes, beer and wine.  I’ll also address why property and motor vehicle taxes, personal and corporate income taxes, and social security payroll taxes are all considered “somewhat or not at all fair” by 40% to 50% of us.  The overall message from these statistics is:

Large issue 1:  While everyone wants government services, many or most of us consider every way of funding them to be “somewhat or not at all fair”.  It will not be enough to establish a way of collecting revenue that is reasonably fair.  We must also routinely measure its fairness, publish the results and measure public opinion about that.  The long term result, if the system truly is fair, will be a steep bell curve of survey results toward the middle of the range from “Very fair” to “Not at all fair”.  I’ll explore this in a future post.

Meanwhile, why are estate taxes considered most unfair of all?  Because they’re associated with death.  That’s why opponents call them the “death tax”.  We’re pretty much terrified of death and we don’t like any taxes, anyway.  Also, opponents tell us it’s double taxation:  “First, they took your hard-earned money in income tax, then they want estate taxes on what’s left?!”  And while in theory we want equal opportunity for all to become wealthy, we probably in reality want our kids to have a better than equal chance.  The message from this statistic is:

Large issue 2:  We are vulnerable to powerful fears and desires that distort our judgment about government and taxes which cannot be soothed from within the tax system.  We would be happier and kinder if we accepted that we will die.  It would be better to prepare our kids to work for what they most want.  The tax system is powerless to help us accept and act upon such truths.

Would estate taxes nonetheless be an effective way to diminish the unfair advantage of parental wealth?  The answer is again, in normal circumstances, no.  Estate taxes are in reality levied on only a tiny fraction of US estates and they are easy to avoid altogether with trusts and provisions in your will.  If, that is, you act on the fact that you will die.

More importantly, revenue from estate taxes fluctuates because people with equal wealth do not die at the same rate every year. That means estate taxes are unsuitable for supporting ongoing levels of spending.   There is also:

Large issue 3:  Wealthy people can relocate their assets.  Not all US states levy estate or inheritance taxes and those that do, have different rates and thresholds.  You can become a resident of a different state if you expect to leave or inherit a large estate.  The same issue exists for state income taxes as this link suggests.  And if you want to avoid US taxes altogether, you can renounce your citizenship and move offshore.  This means tax systems must be appropriate to their competitive environment, state-wise and nation-wise.

There are, however, a couple of situations where estate taxes are effective.  One is when there is a widely accepted temporary need for exceptionally high government spending.  By the end of WW2, for example, the top marginal estate-tax rate, referred to as “equality of sacrifice”, was 75% in the UK and 77% in the US.  In WW1 when UK men were being conscripted, very high estate taxes were termed “conscription of wealth”. The other situation is when the domination of a wealthy hereditary aristocracy is overturned.  The sacrifice made necessary by WW1 gave UK social reformers that opportunity.

We should work diligently and hard to avoid the need and opportunity for such a remedy in our own society.

Qualities of an Excellent Tax System

Noting at the start of this project that our tax system has no defined goal and grows ever more bewildering – the Federal tax code alone grew in the past 10 years from 1.4M to 3.8M words – I asked: “What if we had a tax goal and a budget management plan?”  The posts summarized below explore results of the current system to identify what should change.

What We Tax shows how much of what kinds of tax is collected at each level of government.  Federal revenue is chiefly from income and social insurance taxes.  State and Local governments rely mainly on property, sales and inheritance taxes.  Total tax revenue grew steadily as a % of GDP to a peak in 2000 and has since dropped very sharply on two occasions although government spending has not.  Federal taxes are half the total.  Personal income tax is 30% of the total and social insurance 20%.

Who We Tax shows how much tax is paid by each income group.  The lowest fifth whose income averages $12,400 pays 16% of that in sales and other such taxes.  They do not earn enough to pay income tax.  The middle 20% who average about $33,400 pay 25% in taxes overall.  The topmost 1% who average $1.3 million pay 31%.  Tax paid relative to income is similar for all income groups – the top fifth gets 59% of all income and pays 64% of all taxes, the bottom fifth gets 3.5% of all income and pays 2% of all taxes.

The Dept of Health and Human Services judging who has “insufficient income to provide the food, shelter and clothing needed to preserve health” determines that the entire bottom fifth has insufficient income, as does a family of four in the next fifth, and even a family of five in the middle income group.  The bottom fifth, after subtracting the 16% they pay in taxes has $10,400 to support themselves.

What We Do Not Tax examines why our system is so complicated.  Nobody fully understands all the provisions that exclude some income from taxation.  These deductions and payments made via the tax system total almost a third of overall Federal spending, more than $800B in 2012.  That is more than our spending on our three most costly programs, Social Security, defense, and Medicare.

Tax exemptions are popular with politicians because they are less visible than spending programs and generally do not need annual funding decisions.  All the big exceptions have a lot of support with the possible exception of the Earned Income Tax Credit, which benefits only the bottom fifth.  Although the other exemptions are imagined to benefit society in general, they primarily benefit the top 20% and some disproportionately benefit the top 1% income group.

Business Tax explores how our taxes on corporate and other businesses compare to other nations.   Although our top corporate tax rate is among the world’s highest, many of our largest corporations use tax exemptions to pay much lower rates.  GE paid none at all in 2010.  Multinationals manage their accounts to show profits in tax haven countries to avoid US taxes.  All large ones have the advantage of tax deductible debt financing.  What our corporations pay is half the OECD average.

An exceptionally high percentage of our businesses that together produce half of all business net income is not incorporated, which blurs the distinction between business and personal taxes and facilitates legal tax avoidance.

Purpose and Performance of Our Tax System examines its effectiveness, overhead, fairness and clarity.  The system is ineffective, failing by a wide margin to fully fund government activities and allowing illegal evasion on almost a fifth of taxable income.  Its overhead at 30% on income tax is much too high.  It is unfair, only two of five considering it even moderately fair.  Finally, it fails utterly on clarity.

Our current tax and budget management system allows 61% of us to believe the federal deficit can be cut substantially without raising taxes while at the same time opposing cuts to programs that account for 62% of all spending.   Social security cuts are opposed by 79%, Medicare by 76% and defense by 58%.  While opposing cuts to any programs with significant costs, three in four believes almost half of government spending is wasted and imagines cutting programs with relatively tiny costs would be a solution.

That huge compendium of public opinion research confirms in more detail what we in fact already know: we hate taxes, we love benefits.   Home owners hate property taxes but love the mortgage interest deduction.  Almost everyone hates inheritance taxes although hardly anyone has to pay any.  And so on.  What this means is a better tax system will be impossible unless we first agree how we want the tax revenue to be spent.  We will get nowhere considering changes in isolation and make progress only by assessing the impact of potential changes on the outcome we want.

Taxes, Wealth and Fairness explores the outcome we want.  The previous post explored public opinion about fairness and noted, for example, that 66% of us believes “everyone should pay some minimum amount of tax to help fund government”, the implication being that some do not, e.g., the 47% Romney noted who pay no income tax, although as we saw above, the bottom fifth in fact pays 16% of their income in taxes.  This post turns from exploring mechanisms to results, what we mean by saying our tax system should have a fair outcome.

Nine out of ten Americans want a society with a relatively equal distribution of wealth.  The average of our opinions is that the top fifth should have 32% of the total wealth.  What we think they have is close to twice that percentage (59%).  In fact, they have 25% more even than we imagine, a full 84% of our society’s total wealth, and their share is growing fast at the expense of every other group.  Despite great disagreements over policies that affect wealth distribution, e.g., tax and welfare, a great majority of us appears to believe that wealth should be distributed far more equally than we imagine it is, and we imagine it to be distributed much more equally than the reality.

In the next post I will begin exploring different tax approaches to get the system we appear to want, a system that:

  • Fully funds all authorized government activities, not necessarily every year, but on average
  • Makes it easy to understand the impact of proposed tax and spending changes
  • Leads toward the distribution of wealth we democratically choose
  • Has a low collection cost and allows minimal illegal evasion
  • Does not disadvantage US business in the global economy

My biggest surprise from the research is the relatively equal distribution of wealth nine out of ten of us appear to want.  I interpret that to mean we want relatively equal opportunities to become wealthy, which would include relatively equal access to high quality education and health care, for example, as well as relatively little unfair opportunity based on parental wealth.

I began this research because year after year we keep borrowing, not to fund investments for our future, but to keep consuming, and that’s unsustainable.  Better we work our way out of this downward spiral than be forced to when it is more painful.  That motive is the origin of the first bullet point above.  But I now see the deeper problem.  The tax and budget management system we have is not at all what we want.  That’s the origin of the remaining bullet points.

It will be extremely hard to get the tax system nine out of ten of us appears to want.  Inequality as extreme and fast growing as we have (net worth of the wealthiest 7% grew 28% in the past three years while the lower 93% lost an additional 4%) results only when political power based on wealth is shaping government policy.  When we see our tax system’s enormous and confusing volume of laws, we imagine its apparent chaos to have grown randomly.  It can be no accident, however, that it results in wealth flowing always and only to the top.

I will be grateful for any comments about the research, analysis and conclusions so far.  Have I failed to research anything essential, made any flawed analyses, or come to any unwarranted conclusions?

Taxes, Wealth and Fairness

‘Democratic’ in my previous post’s question: “What is the purpose of our democratic society’s tax system?” – means it leads to a fair outcome.  That post explores public opinion about tax fairness.  But what do we mean by a fair outcome?  Taxes are only the means; what about the end, a fair economic structure?  We now explore the previous post’s final question: “How should society’s wealth be distributed?  What do we actually want?”

Determining how to answer such questions was the life work of US political philosopher John Rawls.  His aim was to see how to establish the legitimate use of political power in a democracy; how a society with diverse worldviews can unify for action.  He developed a method (the “original position”) to proceed from our deepest ideas about justice to reach real agreement.  It works when people imagine themselves entering society in a fair position and answer using only factors their intuition considers fundamental.  Phrasing the questions is critically important.  Politicians typically phrase them not to promote agreement but amplify differences.

Professors Norton and Ariely used Rawls’ method to survey (see their Report and an Interview with Ariely) a random sample of 5,500 Americans to explore how we want society’s wealth to be distributed.  They used pairs of pie charts depicting the distribution of wealth from richest to poorest groups among pairs of nations.  They asked respondents which nation of each pair they would rather join:  ‘In considering this question, imagine that if you joined this nation, you would be randomly assigned to a place in the distribution, so you could end up anywhere in this distribution, from the very richest to the very poorest.’’

The pie charts shown to respondents were not labeled.  One showed the existing distribution of wealth in the USA.  One showed all groups having exactly the same.  The third showed another real world case, the distribution of income in Sweden.  They chose that because it is quite different from the others (income in Sweden is distributed relatively equally but wealth is not).

Presented with the pair of charts representing Sweden and the USA, nine out of ten respondents (92%) preferred the Swedish distribution.  The results were consistent across gender, political and economic divides: females 93% vs males 91%, Republicans 90% vs Democrats 93%, income less than $50,000 92% vs $50,001–$100,000 92% vs more than $100,000 89%.  There was a slight preference (51% to 49%) for the Sweden distribution over the equal distribution when they were compared directly and a somewhat larger preference when the choices were Sweden or US  (92% vs 8%) than when they were equal or US ( 77% to 23%).

Relative preference

Those answers are provocative; a huge majority of Americans appears to want a society with a relatively equal distribution of wealth.  But the question is abstract so Norton and Ariely tested the result.  Respondents were next asked what percent of wealth they believe is owned by each of the five economic groups in the United States, and what each ideally should own.  They were given the following definition: ‘‘Wealth, also known as net worth, is defined as the total value of everything someone owns minus any debt that he or she owes. A person’s net worth includes his or her bank account savings plus the value of other things such as property, stocks, bonds, art, collections, etc., minus the value of things like loans and mortgages.’’

The second set of answers is equally provocative, is consistent with the first, and is also consistent with my previous post’s findings about clarity.  Respondents vastly underestimated the actual level of wealth inequality in the US.  They said the wealthiest fifth of Americans holds about 59% of the wealth.  They actually have almost 84%.  They own fully a quarter more of the total than respondents imagine.

Consistent with the pie chart answers, respondents constructed ideal wealth distributions far more equitable than their estimates of the actual.  They want the top fifth to own not 59% of society’s wealth but roughly half that amount, i.e., 32% of the total.  They redistributed what they feel is too much from the top fifth to the bottom three, leaving the second group unchanged, making the third about the same as the second, and more than tripling the share of the poorest group.  As with the first question, the answers were highly consistent across gender, political and income groups.

Percent Wealth Owned

So, despite great disagreements over policies that affect wealth distribution, e.g., tax and welfare, a great majority of us appears to believe wealth should be distributed far more equally than we imagine it is, and we imagine it is distributed much more equally than the reality.

We have extraordinarily mistaken beliefs about the actual level of wealth inequality, and we probably have equally mistaken beliefs about our opportunity to move up in wealth.  Incomes of the lower 80% of the population have been dropping for the past three decades.  Only the top 1% has seen real growth in income.

inequality-p25_change in share of income

Furthermore, in the most recent three years the wealthiest 7% has enjoyed a 28% increase in their net worth, driven largely by the Fed’s successful efforts to boost the stock market, while the lower 93%, whose primary asset, if they have any at all, is typically the equity in their house, has suffered a further 4% loss in wealth.  The Organization for Economic Cooperation and Development (OECD) reports that among all 34 OECD nations, only Turkey, Mexico and Chile distribute their society’s wealth more unequally than we do.

unevenrecovery

Extreme inequality results when political power based on wealth shapes government policy.  That is the norm in autocracies.  It can also happen in a democracy.  Income inequality in Tsarist Russia was not so severe as ours is now.

Is the relatively equal distribution preferred by Norton and Ariely’s respondents optimal?   My guess is we would generate more overall wealth with somewhat greater incentives.  That would be good to know but we already do know our existing distribution is far from most Americans want.  And history tells us that when income from work goes disproportionately and increasingly to the already wealthy as ours does now, it can only, as my mom always said, end in tears.

I hope we will not wait for a revolution but take democratic action to better distribute the wealth our society generates.  I will explore changes to make that more likely in future posts about governance.  But first, I will explore changes that would make our tax system better fit its purpose.

The Purpose and Performance of Our Tax System

What is the purpose of our democratic society’s tax system?  It’s very different from, say, Louis the Sun King’s France.  His Minister of Finance defined taxation as:  “plucking the goose to obtain the largest possible amount of feathers with the smallest possible amount of hissing”.   We only want to collect enough, not as much as possible.  How well does our system perform?  We have better measures than hissing:

  • Effectiveness – % of government activities it funds – is it enough?
  • Overhead – % of what is collected the process costs
  • Fairness – % of the population considering it fair
  • Clarity – extent to which the population understands what the taxes pay for

Effectiveness has two aspects.  First, a perfect tax system would, not every quarter or year, but over the long haul, fully fund our government’s activities.  By this measure, our current system is an abject failure.  The problem is not so much that the gap widens during economic downturns, e.g., lower collections and higher spending post-2007, but that what’s collected is almost always significantly lower than what’s spent.  I’ll comment below (see clarity) on why that is so.  At this point we only need acknowledge that our current tax system is seriously ineffective.

Revenue_and_Expense_to_GDP_Chart_1993_-_2008

The other aspect of effectiveness is what % is collected of the amount the system intends to collect, i.e., how much is illegally evaded.  This 2011 study by the Federal Reserve Bank says: “18-19% of total reportable income is not properly reported to the IRS, giving rise to a “tax gap” approaching $500 billion dollars”.   It is estimated that around $3T of income tax was evaded from 2001-2010.

Overhead means the cost of collecting.  By this measure, too, our system gets a failing grade.  This report, using IRS data, estimates it at 30% for the income tax system.  Local property taxes, for example, have lower overhead.  Embedded point of purchase taxes, e.g., on gasoline, have about 5% overhead.  I haven’t tried to estimate overhead for our overall system.  It would be good to get it a lot closer to 5% and have it cause less hissing.

Measuring fairness is a challenge.  How to define it?  The dictionary definition is simple, “a proper balance of conflicting interests” or “showing no more favor to one side than another” but it is not so obvious how to measure that in a tax system.  Since we are a democracy, the best way is what % of the people considers it fair.   From a recently published 131 page compendium of survey results I selected some of the most illuminating ones about fairness and clarity.

How many of us consider the current system fair?  See below.  A little under half (3% + 40%) and mostly only moderately fair.  A quarter (24%) considers it not at all fair.  Three of five, however, (59%) regard what they personally must pay as fair.  Perhaps they are the same 56% who consider that middle-income people pay their fair share?  Many more, however, (68%) feel the system benefits the rich and three of five (60%) want those who earn more than $1M a year to pay a minimum of 30% in taxes.  Two of five (40%) consider that lower income people pay too much.  Maybe they are lower income?  Fully two thirds (66%) believe everyone should pay some tax although that question is somewhat loaded.  Almost two thirds (64%) think corporations pay too little tax.

  • Would you say that our [federal] tax system is very fair, moderately fair, not too fair or not fair at all? (p. 20, Dec. 2011 Pew) Very fair – 3%,  Moderately fair – 40%, Not too fair – 31%, Not fair at all – 24%)
  • Do you regard the income tax which you will have to pay this year as fair? (p. 23, Apr. 2012 Gallup) Yes – 59%, No – 37%
  • Do you feel the present tax system benefits the rich? (p. 25, Apr. 2012 CNN/ORC) Yes – 68%, No – 29%
  • Are middle-income people paying their fair share in federal taxes, too much or too little? (p. 26, Apr. 2012 Gallup) Too much – 36%, Fair share – 56%, Too little – 6%
  • Are lower-income people paying their fair share in federal taxes, too much or too little? (p. 27, Apr. 2012 Gallup) Too much – 40%, Fair share – 33%, Too little – 24%
  • Are corporations paying their fair share in federal taxes, too much or too little? (p. 27, Apr. 2012 Gallup) Too much – 11%, Fair share – 21%, Too little – 64%
  • Would you favor requiring households earning $1 million a year or more to pay a minimum of 30% of their income in taxes? (p. 31, Apr. 2012 Gallup) Support – 60%, Oppose – 37%
  • [Should] everyone pay some minimum amount of tax to help fund government? (p. 20, Feb. 2009 Harris/Tax Foundation) Should – 66%, Current system is fair – 19%, Not sure – 15%

So, our current tax system is perceived to be less fair than we want.  Another way to look at it is in terms of results.  The tax system takes money from people at different rates and redistributes some of it to others depending on relative circumstances.  How fairly do we think it does that?   Almost three of five (57%) feel money and wealth should be more evenly distributed.  Opinions are, however, equally divided (47% to 49%) on whether the government should redistribute it by heavy taxes on the rich.

  • Do you feel that the distribution of money and wealth in this country today is fair? (p. 33, Apr. 2011 Gallup) Fair – 35%, Should be more evenly distributed – 57%
  • Do you think that our government should or should not redistribute wealth by heavy taxes on the rich? (p. 33, Apr. 2011 Gallup) Should – 47%, Should not – 49%

Another perspective is, are we paying the right amount of tax relative to government spending?  Half of us (47%) think we pay too much tax and half (47%) think what we pay is about right.   But twice as many (61% to 26%) want to pay less, two thirds (67%) are against raising taxes and almost as many (61%) are unwilling to pay more.  How to reconcile the desire to pay less with closing the government’s deficit?  Three of five (61%) believe the deficit can be cut substantially without raising taxes and more than half (53%) favors balancing the budget by cutting spending.

  • Do you consider the amount of federal income tax you have to pay as too high, about right, or too low? (p. 4, Apr. 2012 Gallup)  Too high – 46%, About right – 47%
  • Would you like to see the amount Americans pay in federal income taxes increased, decreased, or remain about the same? (p. 6, Jan. 2012 Gallup) Increase – 13%, Decrease – 61%, Same – 26%
  • Would you favor or oppose raising taxes as a way to reduce the budget deficit? (p. 55, Mar. 2011 PSRA/Pew) Favor – 30%, Oppose – 67%
  • Would you be willing to pay more in taxes to reduce the federal deficit? (p. 50, Jun. 2011 Bloomberg) Willing to pay more – 36%, Not willing – 61%
  • Do you think it is possible to bring down the deficit substantially without raising taxes? (p. 54, Mar. 2011 Bloomberg) Is possible – 61%, Not possible – 37%
  • Which would you prefer to balance the federal budget deficit? (p. 56, Jul. 2011 Economist/YouGov) Increase taxes -10%, Decrease gov’t spending – 53%, Both – 29%

Now we arrive at our tax system’s clarity.  How accurately do we understand the cost of our government’s activities and how that relates to the taxes we pay?  This is where our system fails most spectacularly.  We want to pay less taxes and we imagine we could cut government spending to make that possible.  What spending do we want be cut?  Waste!

We believe almost half of all government spending (47%) is wasted.  Where?  Social Security, the largest program?  Four of five (79%) oppose cutting Social Security spending.  There is less opposition to raising the Social Security eligibility age (44% in favor, 54% opposed).  Opinions are quite evenly divided on what we could save by raising the age of eligibility.  I don’t know what % of the population knows Social Security does not in fact contribute to the deficit – we collect more Social Security taxes than we pay in benefits.

How about cutting Medicare etc, our second largest program?  Opinions are equally distributed from a lot to not much on what that would save but three quarters of us (76%) are in any case against cutting Medicare.

Should we cut defense spending, the third largest area of spending?  Three of five (58%) oppose that but almost half (47%) think we could make very large savings by pulling out of Iraq and Afghanistan and two thirds (66%) favor doing that.  Will they oppose spending the money to invade Iran?

Since the top three areas of spending account for 62% of the total, how to eliminate that 47% of waste?  Two of every three of us (42%) believe we could make very large savings by cutting aid to foreign countries and 72% favor doing that.   Sadly, our total non-military foreign aid in 2011, $32M, is one thousandth of one percent of total federal spending.

  • Do you think people in government waste a lot of money we pay in taxes, waste some of it, or don’t waste very much of it? (p. 15, Apr. 2011 CNN) A lot – 73%, Some – 23%, Not Much – 4%
  • For every dollar you pay in federal taxes, about how many cents do you think are wasted by the government? (p. 16, Jan. 2013 Reason-Rupe) Wasted – 47%
  • In order to reduce the budget deficit, would you favor or oppose reducing spending on Social Security? (p. 60, Mar. 2013 CBS) Favor – 18%, Oppose – 79%
  • Would you favor or oppose gradually raising the age of eligibility for Social Security to 69? (p. 53, Mar. 2011 Bloomberg) Favor – 44%, Oppose – 54%
  • Savings by gradually raising the age of eligibility for Social Security to 69 would be? (p. 53, Mar. 2011 Bloomberg) Very large – 19%, Fairly large – 28%, Fairly small – 24%, Little difference – 24%
  • Would you favor or oppose significantly reducing benefits for Medicare? (p. 53, Mar. 2011 Bloomberg) Favor – 22%, Oppose – 76%
  • Savings by reducing benefits for Medicare would be? (p. 53, Mar. 2011 Bloomberg) Very large – 19%, Fairly large – 25%, Fairly small – 27%, Little difference – 24%
  • In order to reduce the budget deficit, would you favor or oppose reducing defense spending? (p. 60, Mar. 2013 CBS) Favor – 38%, Oppose – 58%
  • Savings by pulling all troops out of Iraq and Afghanistan would be? (p. 53, Mar. 2011 Bloomberg) Very large – 47%, Fairly large – 28%, Fairly small – 12%, Little difference – 11%
  • Would you favor or oppose pulling all troops out of Iraq and Afghanistan? (p. 53, Mar. 2011 Bloomberg) Favor – 66%, Oppose – 30%
  • Savings by cutting aid to foreign countries would be? (p. 53, Mar. 2011 Bloomberg) Very large – 42%, Fairly large – 30%, Fairly small – 14%, Little difference – 10%
  • Would you favor or oppose significantly cutting aid to foreign countries? (p. 53, Mar. 2011 Bloomberg) Favor – 72%, Oppose – 26%

Fed Spending Pie Chart

This is already a long post so I will make only two comments about state and local taxes.  Property taxes are considered the most unfair of all, perhaps because they may force folks whose incomes drop sharply at retirement to sell their home.  Estate taxes, primarily federal but which have also been levied by some states, are also very unpopular, which is inconsistent with our idealization of the “self-made man”.

The next post in this series will say more about fairness.  How should society’s wealth be distributed?  The cynic would expect all of us to think we personally should have more.  What do we actually want?  My analysis of our current tax system and how its results compare to what we want will at that point be sufficiently complete.   I will then force myself to establish some proposals for a better system.

Business Tax

Because we tax the income of legal entities, i.e., corporations, not just people, this post extends the exploration of who we tax.   Corporations are not the only form of business enterprise so it examines our overall business tax system.  It does not, however, address who ultimately pays business taxes; the customers who unknowingly pay a higher price, owners who unknowingly provide additional capital and/or, other academics say, employees.

Personal income tax is on gross income but corporate is on net, i.e., profits.  In other words, while most costs of earning a wage are taxed, most of a corporation’s costs are not.  Both income taxes have lower rates for lower amounts of income, and both are levied by states and the federal government.  Federal rates start at 15% for the first $50K of corporate income, which is more than the total income for over 90% of US corporations.  States levy at an effective rate in the range of 2% to 5%.

In an increasingly competitive global economy, how do our business taxes compare to other nations?  Our top corporate tax rate, federal plus state and local, is among the world’s highest but that is not necessarily what businesses pay.  GE, for example, our 6th largest business by revenue and 14th most profitable, paid no tax at all in 2010.  The rate US businesses actually pay is where it starts to get complicated.

There are many ways to compute effective business tax rates, i.e., what businesses actually pay.  “Effective 1” in the table below from the US Treasury calculates it as corporate taxes versus corporate operating surplus.  Using that formula, we are at 13%, which is lower than the 16% average for OECD nations and almost the same as Canada.  The formula used by the equally authoritative World Bank, however, “Effective 2”, places us highest at 28%, almost double the OECD average and four times as high as Canada and France.  The formula used by a source with a tax reduction agenda, which gives the rate on the highest income bracket, i.e., the “Marginal” rate, shows us at 36%, which is also twice the OECD average.  Trying to figure what percentage of profits corporations pay in taxes leads to no definite conclusions.

Corporate Tax Rates

Tax collected as a percentage of GDP is a dependable measure, however.  It shows how our business tax system compares to other nations and it illuminates the trends.  This measure shows the 3.4% average for all OECD nations over the years 2000-2005 was over 50% higher than our 2.2% rate.  Only Germany’s was lower.  And the OECD average for 2008 was almost twice as high as ours.

US corporate income tax as a share of GDP dropped until the early 1980s and was relatively stable in the range of 1% to 2% for the next two decades.  In the most recent decade it has fluctuated more but has not yet dropped back to 1% as forecast in the chart below from the Tax Policy Center.

corporate_gdp

Why do US corporations pay such a small amount of tax?  This US Treasury background paper notes that our business tax system: “includes an array of special provisions that reduce taxes for particular types of activities, industries, and businesses”.  Some of those tax preferences are reviewed in what we do not tax.   The report estimates that: “If the tax base were broadened by removing these special provisions, the top [federal] corporate tax rate of 35 percent could be reduced to 27 percent.” 

The Treasury report also points out a further complication: “A substantial share of [US] business activity and income is generated by flow-through entities not subject to the corporate income tax but instead generally taxed to individual owners” and notes that: “Although many of these 27 million businesses are small, in the aggregate they generate about one-third of business receipts and total deductions and one-third of salaries and wages … [and they] produce half of business net income”.

Unincorporated Businesses

Two thirds of all US businesses reporting profits of $1 million or more in 2004 were not incorporated, far more than in other nations.  Why?  A primary reason for business owners to incorporate is to receive limited liability protection but in the US we also have S corporations, limited partnerships, and limited liability companies that offer protection.  Legislation establishing S corporations introduced in 1986 applies to companies with 35 or fewer shareholders.  Their income is passed through to the owners for tax purposes as in a partnership.  S corporations do not pay corporate income tax.

How is taxing US businesses affected by globalization?  US companies only pay local taxes on foreign subsidiaries’ profits if they are returned to the US.  This means they can dramatically lower their taxes by recording profits in subsidiaries in tax havens like Bermuda.  Their intellectual property (IP), e.g., patents, can be owned by a subsidiary in a low tax offshore jurisdiction.  Payments to the subsidiary for use of the IP by the corporation’s high-taxed US entity reduces the US entity’s profit.  The artificial profits of the subsidiary are said to be deferred because they will be taxed at US rates if they are returned to the US, but in effect they have been transferred where they are not subject to US taxes.

Deferred_Corporate_Foreign_Earnings_2001-2010

Our business tax system greatly favors large enterprises that can take advantage of foreign subsidiary tax accounting complexities.  It benefits large enterprises in many other ways, too.  They have more access to debt financing, for example, and because interest expenses are treated as a cost of doing business, that cuts their taxes.  It is tempting to delve deeper into how large businesses and their executives are favored but the goal of these posts is to explore not detailed mechanisms of our tax system but its overall results.  The next post in this series will assess those results and how they compare to what we want.  Finally, I will explore some potential changes.

What We Do Not Tax

Previous posts in this series showed what we tax and who we tax.  Now we turn to what makes our tax system so confusing, things we do not tax.  These “tax exemptions” include income that’s excluded from taxation, deductions that reduce tax, and payments distributed to people via the tax system.

Tax exemptions are government spending that differs from spending on defense, Social Security or etc only in an accounting sense.  As the CBO wrote:  “Do you receive a tax deduction for interest paid on your mortgage or taxes to your state and local governments?  Would you think about it in the same way if instead of seeing a reduction in taxes the federal government sent you a check for the same amount?”   It makes a big difference politically.  Tax exemptions are much less visible than spending programs and they generally do not need annual funding decisions.

Tax exemptions are a surprisingly large part of all Federal spending, around 30% of the total (see August 2011 National Bureau of Economic Research (NBER) Working Paper 17268 here  They are treated differently in the budget process because they are considered to be tax cuts, which makes them less vulnerable to attack than spending.  The individual and corporate income tax code now contains almost 200 tax preferences that Treasury estimates result in more than $1T of uncollected potential Federal income tax, more than a quarter of the $4T that is collected.

Share of Spending

The next chart shows the major tax exemptions.  The Joint Committee on Taxation (JCT) and CBO estimates are lower than Treasury’s but still enormous:

  • They total more than $800B in 2012.  That is more than spending on Social Security, defense, or Medicare.
  • They will total nearly $12T in the decade starting in 2013, which is 5.8% of GDP.

CBO tax-expenditures

The largest tax expenditure is exclusion of employer contributions for health care.  Employees who get this benefit do not pay tax on its value.  It is projected to equal 1.8% of GDP over the 2013–2022 period.  Next largest is exclusion of pension contributions and earnings, estimated to total 1.1% of GDP over that period, then deduction for interest paid on mortgages projected at 0.8% of GDP, preferential rates on dividends and long-term capital gains at 0.5% of GDP and the earned income tax credit for some low-income workers at 0.3% of GDP between 2013 and 2022.   The rate of growth in value of the exemptions differs.  The deduction for state and local taxes has remained fairly flat even since 1980-4 while exclusion of employer pension and medical contributions has substantially increased.

Tax Expenditure Trends - Individual

Tax expenditures were almost invisible before 1967, when Treasury Assistant Secretary Surrey originated a list of “government spending for favored activities or groups, effected through the tax system rather than through direct grants, loans, or other forms of government assistance”.   He wanted to make them visible because tax expenditures have almost exactly the same effects as traditional spending programs on the budget, resource allocation, relative prices, and the distribution of income.   Economist David Bradford pointed out that if arms manufacturers got tax credits from the Pentagon instead of cash, that spending would not show up in the Defense budget, tax revenues would fall by the same amount, and yet government would be doing the same thing.  Only the accounting would change.

Who benefits from tax exemptions?  The following table and charts are drawn from data in the December 2008 Tax Policy Center paper, “How Big Are Total Individual Income Tax Expenditures, and Who Benefits from Them?”

Distribution of Impact Tax Expenditures Table

The exclusion of employer contributions to pensions primarily benefits those with the highest incomes.  Those in the top 20% of income get an average of 2.34% more after-tax income, for example, than they would without this exclusion.  Lower rates on capital gains than ordinary income and deduction of mortgage interest, state and local taxes and charitable contributions also offer most benefit to those with the highest incomes because they have the highest marginal tax rates.  All but the bottom 20%, however, get 1.4% to 2.16% more than they would without the exclusion of employer health care contributions.  The earned income tax credit (EITC) is the only one that significantly benefits the bottom income group, as it is intended to do.

Only the EITC is overtly aimed at a specific income group.  The others are spoken of as if they benefit society in general but they in fact benefit primarily the top 20%.  Some disproportionately benefit only those in the top 1% income group.  If providing special benefits to the top 1% or 20% was defined as our national policy, it would presumably not be favored by the majority.  But the objectives of our tax system are not defined and its special benefits are almost invisible.

The next post in this series will explore business taxes and some ways they can interact with personal tax.  That is confusing.  Partners in firm’s like Romney’s Bain Capital, for example, get taxed on investment profits at the 20% capital gains rate not the 39.6% top ordinary income rate even if they only manage others’ investments.  Executives of large corporations can defer payment of income so it is not taxed in the year it was earned.  And so on.

My intent in this and the next post is to give an overall sense of some positive and negative aspects of our current tax system for different income groups and for individual, corporate and other legal entities.  These and the two previous posts are background for an exploration of goals we might set for a tax system and the pros and cons of some potential changes.

Who We Tax

What and how much our Federal, State and Local governments tax is summarized here.  Now, who pays what fraction of the total?

We’ll start with people, then corporations.  This chart shows what % of total taxes is paid by each income group.  The lowest 20% who average about $12,400 per year, paid 16% of their income in taxes in 2009.  Less than 4%, a quarter of their total, is income tax.  The rest is sales and other kinds of tax.

The next 20% who average about $25,000/year paid 21% of their income in taxes, about 40% of their overall tax being income tax.  The middle 20% who average about $33,400/year paid 25% in total.  The next 20% who average about $66,000/year paid 29%.

The top 20% is broken down in more detail.  The lower half who average about $100,000/year pay 30% and the next 5% who average $141,000/year pay 31%.  The next 4% who average $245,000/year pay 32%.   The top 1% who average $1.3 million/year pay 31% of their income to taxes.  This means that while a higher percentage of total tax is paid by each group in the bottom 80%, the rate of increase then slows and the top 1% pays less than the 9% below and little more than the 10% below them.

Wealth, Income and Taxes - 9

What may be more surprising is the share of total tax paid by each group relative to its share of total income.  The top 20% gets 59% of all income and pays 64% of all taxes.  The bottom 20% gets 3.5% of all income and pays 2% of all taxes.  The top 20% pays a greater share of taxes than they receive of income, but the ratio is not very different across the entire range of incomes.

Wealth, Income and Taxes - 10

What is the result of total taxes on each income group?  The Dept of Health and Human Services determines eligibility for federal programs using thresholds below which families are considered to be “lacking the resources to meet the basic needs for healthy living; having insufficient income to provide the food, shelter and clothing needed to preserve health”.  The Census Bureau reported 16% of Americans below the poverty threshold at the end of 2012.

US_poverty_rate_timeline

The following table shows how average post-tax income of each income group compares to what I call “disposable income”, the difference between the poverty threshold and the average post-tax income of each group.  A single person in the lowest 20% group, for example, with a pretax income of $12,400 who pays that group’s average of 16% in total taxes has a post-tax income of $10,416, which is $754 less than the $11,170 poverty threshold for a single person.  If they had a spouse and their joint post-tax income was the same $12,400, their post-tax income would be $4,714 less than the poverty threshold.  A family of four in the second 20% would be $3,175 below their poverty threshold.  Even in the middle 20% a family of five would be living in poverty.

Income by Quintile Table_Page_1

The first of the following charts highlights the result of total taxes on the lower income 90% of Americans, the second gives a sense of the very high disposable income available to the top 1%.  In a future post I will examine what distribution of wealth Americans believe is desirable.

Income by Quintile Chart 1

Income by Quintile Chart 2

Turning now to corporations, we know they, too, pay varying combinations of income, social security, property and other taxes.  I suspect their share of total taxes and total income has a similar pattern as for individuals but I have not found the necessary data to know.  Corporations have recently grown enormously more profitable, especially large multinationals.

Corporate Profits after Tax

The effective corporate  tax rate has fallen pretty steadily from 50% at the end of WW2 to 17% now.  Since there are ways not available to smaller businesses that large multinationals can use to avoid tax, I expect the effective tax rate would be much lower for large corporations.

US_Effective_Corporate_Tax_Rate_1947-2011_v2

This is not an academic exercise so I will not try to quantify total tax rates paid by corporations categorized by their income size.  It will be more illuminating to explore in the next post what we do not tax – exemptions, deductions and so forth – and how what we do not tax impacts different income groups.