Love and Birthdays

One of our kids’ favorite books many years ago, “A Birthday for Frances”, movingly captures the complexity of love.  “Happy birthday to me is how it should be”, Frances sings.  She announces she is not going to get her sister a birthday present, then dissolves into tears because she is the only one not getting her a present.  We love ourselves, we love others, how can we love both at the same time?

But do we even have a self?  “Writers aren’t exactly people,” according to F. Scott Fitzgerald, “they’re a whole bunch of people trying to be one person.”   I remember that feeling.   Every reflective adolescent goes through the same existential scare.  For me, it was exacerbated by the then-recent publication of “Three Faces of Eve” about a woman with three separate personalities, by Colin Wilson’s more intellectually respectable “The Outsider” and by the fact that one of my closest friends whose father was a psychologist was deeply expert about schizophrenia and dissociative personality disorder and saw evidence of them everywhere.

A few years later, it seemed to me I did have a self even though it had an unusual combination of interests.  Most of us come to that conclusion.  We start work to support ourselves, maybe do some self-actualizing in the process, perhaps start a family, in any case become very busy – too busy to consider whether our self has any fixed properties.  We might notice our interests and behaviors changing, that we react the same way our parents did, that we’re looking increasingly like someone else in our family, but we don’t consider what those changes indicate.

Only recently I came to realize there’s actually nothing at all fixed about “me”.  Now, I see that more and more of the pieces of what I used to think of as “me” are the result of genetic and experiential memories.  I see they’re continuing to change, and I haven’t identified anything at all that is fixed.  I’m lucky to have lost that delusion of “self” because it helps me resolve Frances’ dilemma, the selfishness I’ve tried for so long to overcome.

That’s why I had Facebook show today as my birthday.   It’s not the anniversary of when my mother gave birth to me but the day I began life in the USA.  It might better be termed my rebirth but that whole way of thinking – birth, death, rebirth and so on – just leads to confusion.  There have been so many days, before and after my physical birth, that gave birth to what still feels like “me”.

Knowing deeply that “self” is an illusion will require a lot more work.  That’s work worth doing – a good birthday resolution.  How fine it would be if every one of us could wholeheartedly celebrate every instant as everyone’s birthday.

Business Tax

Because we tax the income of legal entities, i.e., corporations, not just people, this post extends the exploration of who we tax.   Corporations are not the only form of business enterprise so it examines our overall business tax system.  It does not, however, address who ultimately pays business taxes; the customers who unknowingly pay a higher price, owners who unknowingly provide additional capital and/or, other academics say, employees.

Personal income tax is on gross income but corporate is on net, i.e., profits.  In other words, while most costs of earning a wage are taxed, most of a corporation’s costs are not.  Both income taxes have lower rates for lower amounts of income, and both are levied by states and the federal government.  Federal rates start at 15% for the first $50K of corporate income, which is more than the total income for over 90% of US corporations.  States levy at an effective rate in the range of 2% to 5%.

In an increasingly competitive global economy, how do our business taxes compare to other nations?  Our top corporate tax rate, federal plus state and local, is among the world’s highest but that is not necessarily what businesses pay.  GE, for example, our 6th largest business by revenue and 14th most profitable, paid no tax at all in 2010.  The rate US businesses actually pay is where it starts to get complicated.

There are many ways to compute effective business tax rates, i.e., what businesses actually pay.  “Effective 1” in the table below from the US Treasury calculates it as corporate taxes versus corporate operating surplus.  Using that formula, we are at 13%, which is lower than the 16% average for OECD nations and almost the same as Canada.  The formula used by the equally authoritative World Bank, however, “Effective 2”, places us highest at 28%, almost double the OECD average and four times as high as Canada and France.  The formula used by a source with a tax reduction agenda, which gives the rate on the highest income bracket, i.e., the “Marginal” rate, shows us at 36%, which is also twice the OECD average.  Trying to figure what percentage of profits corporations pay in taxes leads to no definite conclusions.

Corporate Tax Rates

Tax collected as a percentage of GDP is a dependable measure, however.  It shows how our business tax system compares to other nations and it illuminates the trends.  This measure shows the 3.4% average for all OECD nations over the years 2000-2005 was over 50% higher than our 2.2% rate.  Only Germany’s was lower.  And the OECD average for 2008 was almost twice as high as ours.

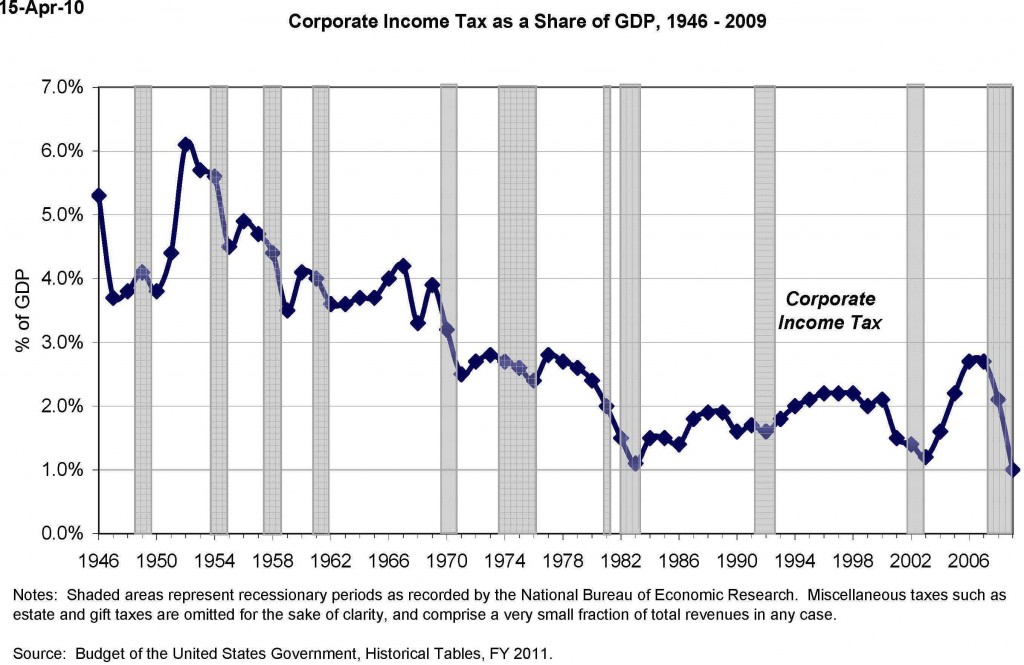
US corporate income tax as a share of GDP dropped until the early 1980s and was relatively stable in the range of 1% to 2% for the next two decades.  In the most recent decade it has fluctuated more but has not yet dropped back to 1% as forecast in the chart below from the Tax Policy Center.

corporate_gdp

Why do US corporations pay such a small amount of tax?  This US Treasury background paper notes that our business tax system: “includes an array of special provisions that reduce taxes for particular types of activities, industries, and businesses”.  Some of those tax preferences are reviewed in what we do not tax.   The report estimates that: “If the tax base were broadened by removing these special provisions, the top [federal] corporate tax rate of 35 percent could be reduced to 27 percent.” 

The Treasury report also points out a further complication: “A substantial share of [US] business activity and income is generated by flow-through entities not subject to the corporate income tax but instead generally taxed to individual owners” and notes that: “Although many of these 27 million businesses are small, in the aggregate they generate about one-third of business receipts and total deductions and one-third of salaries and wages … [and they] produce half of business net income”.

Unincorporated Businesses

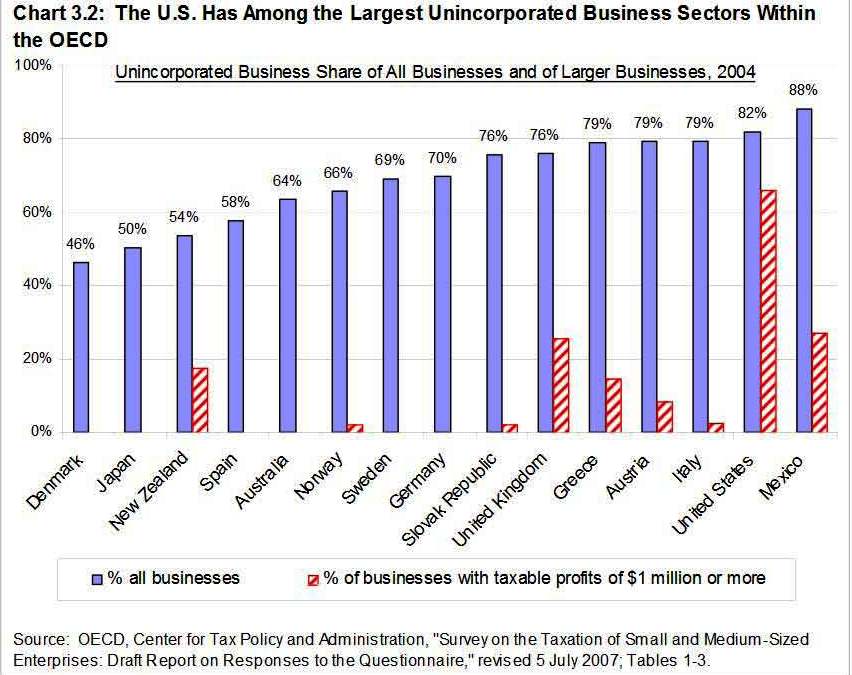
Two thirds of all US businesses reporting profits of $1 million or more in 2004 were not incorporated, far more than in other nations.  Why?  A primary reason for business owners to incorporate is to receive limited liability protection but in the US we also have S corporations, limited partnerships, and limited liability companies that offer protection.  Legislation establishing S corporations introduced in 1986 applies to companies with 35 or fewer shareholders.  Their income is passed through to the owners for tax purposes as in a partnership.  S corporations do not pay corporate income tax.

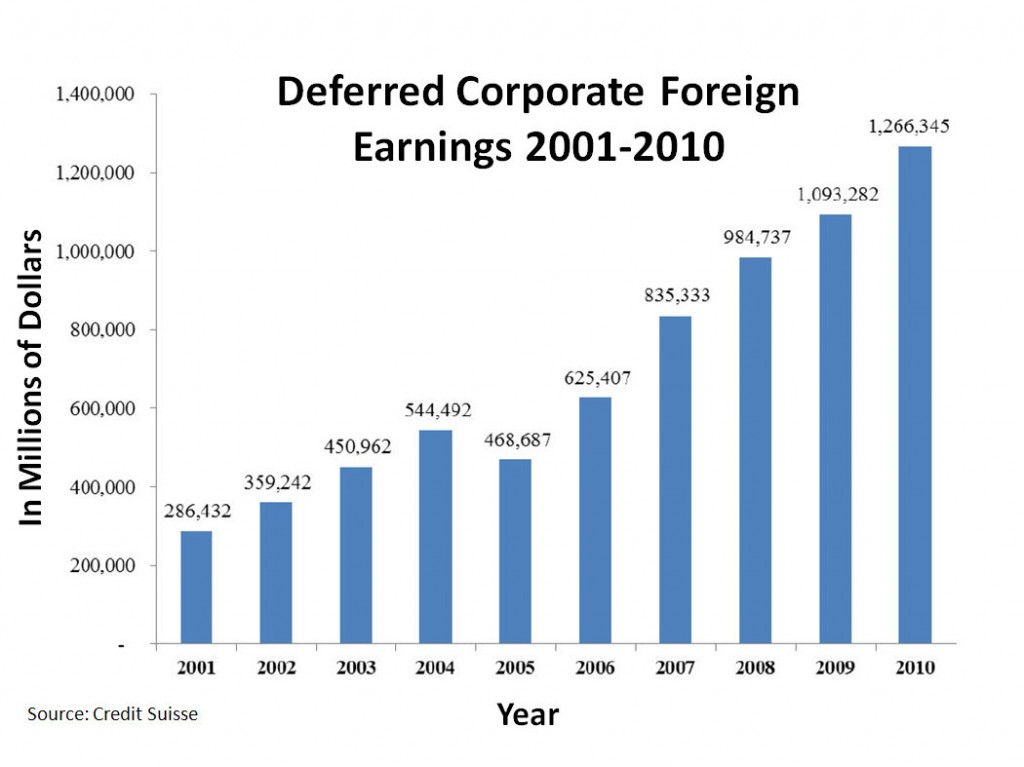
How is taxing US businesses affected by globalization?  US companies only pay local taxes on foreign subsidiaries’ profits if they are returned to the US.  This means they can dramatically lower their taxes by recording profits in subsidiaries in tax havens like Bermuda.  Their intellectual property (IP), e.g., patents, can be owned by a subsidiary in a low tax offshore jurisdiction.  Payments to the subsidiary for use of the IP by the corporation’s high-taxed US entity reduces the US entity’s profit.  The artificial profits of the subsidiary are said to be deferred because they will be taxed at US rates if they are returned to the US, but in effect they have been transferred where they are not subject to US taxes.

Deferred_Corporate_Foreign_Earnings_2001-2010

Our business tax system greatly favors large enterprises that can take advantage of foreign subsidiary tax accounting complexities.  It benefits large enterprises in many other ways, too.  They have more access to debt financing, for example, and because interest expenses are treated as a cost of doing business, that cuts their taxes.  It is tempting to delve deeper into how large businesses and their executives are favored but the goal of these posts is to explore not detailed mechanisms of our tax system but its overall results.  The next post in this series will assess those results and how they compare to what we want.  Finally, I will explore some potential changes.

The Life of a Tortoise

A wild tortoise who lives near the cabin where we were staying in the high desert above Yucca Valley, CA has learned that people will give him lettuce.

IMG_0465

He comes out when he hears people because he likes lettuce.  There’s only just enough plant life for survival in those parts so it’s easy to see why he’d be tempted.

IMG_0469

He’s been living there for at least 30 years and has a female consort who we didn’t see.  Maybe she didn’t come out because she’s shy, more likely because the weather wasn’t really hot enough yet, or perhaps it was because he told her not to.  He has a rival, a bigger fellow, with whom he battles for control of the territory and access to the female.  The way battle works for tortoises is they try to flip each other over.  An upside-down tortoise has no way to right itself and soon dies.

These battles must be noisy.  The tortoise hissed loudly if we did not give him the next piece of lettuce as fast as he wanted.  I expect he’d look even more menacing if the issue was survival.

IMG_0477

He usually loses the battles because he’s smaller than the interloper, but not always.  Our landlady once found both of them on their backs.  She checks on them many times a day when the weather is hotter and had to right the home tortoise five times one day.  She has repeatedly taken the interloper several miles away in her car but he always comes back.

Opposing Senate Resolution 65 re Iran & Israel

Please, everyone, join me in urging your Senators to defeat Senate Resolution 65 which would commit us to a disastrous war with Iran that would not even be entered into by our own decision.  Use my letter below as a base if it helps.  I’m sending a slightly different version to my other Senator, Angus King, because he has not sponsored the Resolution.

With these links you can get your Senators’ email address and if they sponsor S.Res.65 as well as its text.

Dear Senator Collins,

With utmost seriousness I urge you to withdraw your support for, and in fact work to defeat Senate Resolution 65.

S.Res. 65’s conclusion, “if the Government of Israel is compelled to take military action in self-defense, the United States Government should stand with Israel and provide diplomatic, military, and economic support to the Government of Israel” would commit us to war with Iran whenever Israel decides.  It  would not be our Government but Israel’s that decides whether or not to invade Iran.

Although S.Res.65 ends: “Nothing in this resolution shall be construed as an authorization for the use of force or a declaration of war”,  that is exactly what it is.  If the Government of Israel decides to strike Iran, S.Res.65 would commit us, too.

War on Iran is very much against our interests.    As former Secretary of Defense (2006-2011) Robert Gates, said in a speech on October 3 last year: “The results of an American or Israeli military strike on Iran could, in my view, prove catastrophic, haunting us for generations … An attack would make a nuclear-armed Iran inevitable.  They would just bury the program deeper and make it more covert.” 

Just like the claim that Iraq had weapons of mass destruction, the claim that Iran is making nuclear weapons is false.  US Director of National Intelligence James Clapper told the Senate on March 12 this year: “We do not know if Iran will eventually decide to build nuclear weapons”.  He said Iran is not enriching to weapons grade and we could quickly detect it if they do.  Inspectors at the International Atomic Energy Agency who monitor Iran’s nuclear sites say the same thing.

I care deeply about this both as an American and a parent.  I proudly support our son’s service in the military.  I believe you care about him, too.  Do not blindly commit him to a war that is against our interests and would not even be entered into by our own decision.

Respectfully,

Afghanistan, Pakistan, Iran, and More

Our foreign policy is bankrupting us, poisoning the minds of our children, and turning the world against us.

Iraq:  We have so far spent $1.7T on war in Iraq and will pay $490B more in benefits to veterans, according to the Costs of War Project at Brown University.  The rationale that Iraq possessed weapons of mass destruction was false.  The results are a traumatized Iraqi society, reinvigorated Islamist militants throughout the region, and we destroyed Iran’s only military rival.

Afghanistan:  The combined cost of our wars in Iraq, Afghanistan and Pakistan is almost $4T.  The estimated death toll from the three wars is 330,000.  The rationale was to make Afghanistan a well ordered democracy that could no longer be used as a refuge by Al Queda.   But unless we remain there permanently, the Taliban will regain control.

Pakistan:  The UN terrorism and human rights envoy just issued a statement that our drone strikes in Pakistan violate international law.  “The position of the government of Pakistan is quite clear,” he said.  “It does not consent to the use of drones by the United States on its territory and it considers this to be a violation of Pakistan’s sovereignty and territorial integrity”.  See here for a table and map of our drone strikes inside Pakistan.

Libya:  After we supported the French-led overthrow of Gaddafi, his Tuareg supporters allied with Islamist militants to fight for the independence of northern Mali.  A French-led force is now pushing them back but they can return temporarily to Libya, or just as easily go to Algeria, Niger or Mauritania.  Throughout North Africa the driving force is not nation states set up in the relatively recent past by France and other European conquerors but milennia of tribal rivalry.

Yemen:  Bordering Saudi Arabia and major oil shipping lanes, Yemen was almost brought to civil war last year by southern separatists and northern rebels.  They sabotaged its major oil pipeline for long enough to shut down Yemen’s main refinery.  They blew it up again a couple of weeks ago.  Meanwhile, we’ve made 65 drone attacks in southern Yemen, mostly in the last 15 months, according to this report.

Syria:  Secretary of State Kerry recently promised aid to fighters against the Syrian government.   Because there is little real separation between them, the al-Nusra Front and others we say are terrorists, some of our aid will inevitably get to the terrorists.

Iran:  We say Iran is developing nuclear weapons and threaten whatever it takes to stop them.   Late last year former Secretary of Defense (2006-2011) Robert Gates said: “The results of an American or Israeli military strike on Iran could, in my view, prove catastrophic, haunting us for generations … An attack would make a nuclear-armed Iran inevitable.  They would just bury the program deeper and make it more covert.”  The US Director of National Intelligence told the Senate this week that Iran is not enriching to weapons grade and we could quickly detect it if they do.  Inspectors at the International Atomic Energy Agency who monitor Iran’s nuclear sites say the same thing.

Insanity:  But, stupefyingly,  Senator Lindsey Graham (R-SC) recently introduced “for himself, Mr. Menendez, Ms. Ayotte, Mr. Schumer, Mr. Cornyn, Mrs. Boxer, Mr. Rubio, Mr. Casey, Mr. Hoeven, Mrs. Gillibrand, Mr. Kirk, Mr. Blumenthal, Mr. Crapo, Mr. Cardin, Ms. Collins, Mr. Begich, Mr. Blunt, Mr. Brown, Mr. Wyden, Mr. Portman, Mr. Manchin, and Mr. Lautenberg” Senate resolution 65 which “urges that, if the Government of Israel is compelled to take military action in self-defense, the United States Government should stand with Israel and provide diplomatic, military, and economic support to the Government of Israel in its defense of its territory, people, and existence.” 

S.Res.65 means:  It would not be our President but Israel’s who decides whether or not to invade Iran.  S.Res.65 ends: “Nothing in this resolution shall be construed as an authorization for the use of force or a declaration of war”.  That is, however, exactly what it does do.

I will not say more in this post about the cost or counter-productiveness of our invasions of Iraq or Afghanistan.  I will just highlight again Secretary Gates’ warning: “a military strike on Iran could … haunt us for generations” and say why drones are not the answer.

Drones:  See this excellent piece on the legality, morality and practicality of drones:  “[they] provide a highly efficient way to destroy key enemy targets with very little risk.  But they also allow the enemy to draw the United States into additional theaters of operation … in the jihadists’ estimate, the broader the engagement, the greater the perception of U.S. hostility to Islam, the easier the recruitment until the jihadist forces reach a size that can’t be dealt with by isolated airstrikes.”

Islam:  It’s not just that drone attacks make other people believe we are hostile to Islam.  A teacher friend tells me our relentlessly sensational media reporting has made our own children believe Muslims hate us.

What we must do:  Stop trying to control the world.  In particular, stop threatening Iran.  They do not have nuclear weapons.   Fearing they would attack with them is foolish because Iran would be destroyed if they did.  Therefore, they will not.  Never again go to war to destroy weapons that do not exist or make wars that cannot be won.  Scuttle Senate Resolution 65.

Seeing, Feeling, Thinking and Blogging

Last November I lost my glasses in Kathmandu.  I was taking classes and couldn’t hold texts far enough away to read, so I bought drugstore reading glasses.  With them what’s close is clear but all else is blurred.  Without them only what’s distant is clear.  The new prescription glasses I got yesterday should make everything clear but the optician said: “It will take you a couple of days to learn where things are”.

Seeing:  I’d never thought about it in that way.  I hadn’t noticed the feedback loop where my brain directs my eye muscles to change focus between what’s close and more distant.  It happens fast so I imagined everything is always in focus.  I’d have realized it’s not if I’d thought about it, but there never was a reason to.  With the new glasses I must learn to tip my head up and down so my eyes see through the right part of the lens.  That requires practice.

Feeling:  Last night I finished the first book I’ve read by Ron Rash, “The Cove”.  I intend now to read everything he ever wrote.  I knew early on how the story must end, not the specific outcome but what the situation makes inevitable.  Half way through, I wanted to stop.  I was feeling what the protagonists feel, knowing I’d do the same as those I liked, and that I share the weaknesses of those who would do harm.  The story is sadder even than I anticipated, and utterly convincing.  Why choose to experience such feelings?  Because I understand a little more.

Thinking:  Yesterday, I heard on the radio about the Ku Klux Klan in Maine in the 1920s.  I thought it was all about white supremacy and only in the South.  In fact, it was strong here, too, but with a different target, Catholics.  There were violent anti-Catholic riots here in the 1850s.  A mob inflamed by a street-preacher calling himself “The Angel Gabriel” burned a Catholic church, a Catholic priest was tarred and feathered, and there was much more.  In the 1920s, the Klan arose.  They whipped up the ongoing conflict between descendants of the English and the Irish and French-Canadian Catholics who came later.  Klan members were elected by many towns, as State representatives and one even became Governor.  There were daylight hooded marches, cross-burnings and Catholic homes were burned.  It was unsafe to speak French in public.  The Klan fizzled within a decade but their Governor later was elected to the US Senate and became a close ally of Senator Joe McCarthy.  How can anyone think it’s OK to do such things?

Blogging:  A day or two ago, a friend said: ” I like your posts about tax.  It must take a lot of work.  Why are you doing it?”  I always enjoyed the challenge of understanding things and the elation when understanding dawns.  Our society is not functioning well and the tax system is one important factor so I want to know what big impacts it has and how it could be changed to help society work better.  “Articulating what I think I understand is my best way to test if I do understand.  That’s why I write,”  I told my friend.  “But it’s not helpful if I don’t tell anyone when I see something important that isn’t generally understood.  That’s why I publish what I write.”

What We Do Not Tax

Previous posts in this series showed what we tax and who we tax.  Now we turn to what makes our tax system so confusing, things we do not tax.  These “tax exemptions” include income that’s excluded from taxation, deductions that reduce tax, and payments distributed to people via the tax system.

Tax exemptions are government spending that differs from spending on defense, Social Security or etc only in an accounting sense.  As the CBO wrote:  “Do you receive a tax deduction for interest paid on your mortgage or taxes to your state and local governments?  Would you think about it in the same way if instead of seeing a reduction in taxes the federal government sent you a check for the same amount?”   It makes a big difference politically.  Tax exemptions are much less visible than spending programs and they generally do not need annual funding decisions.

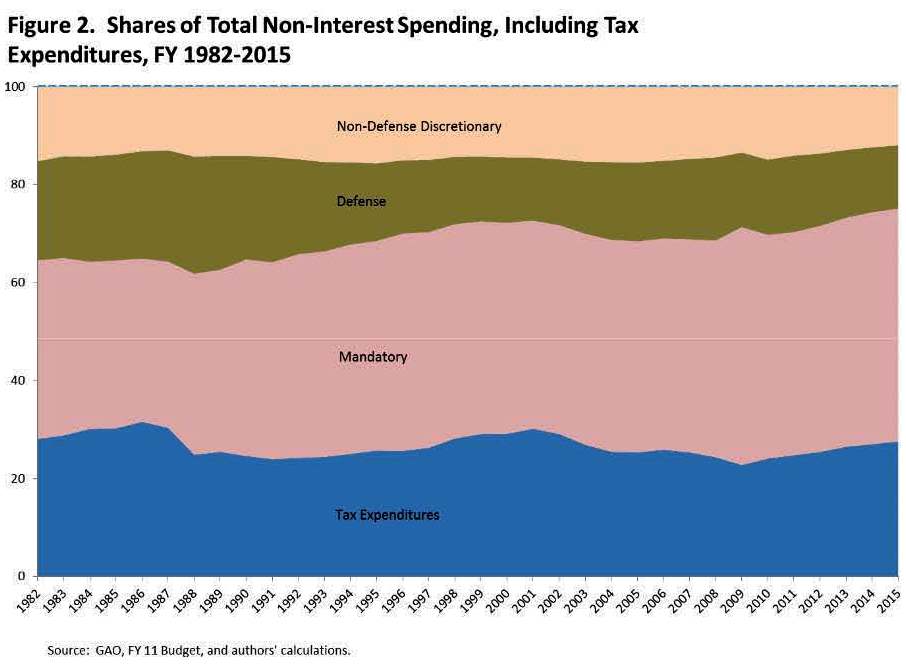
Tax exemptions are a surprisingly large part of all Federal spending, around 30% of the total (see August 2011 National Bureau of Economic Research (NBER) Working Paper 17268 here  They are treated differently in the budget process because they are considered to be tax cuts, which makes them less vulnerable to attack than spending.  The individual and corporate income tax code now contains almost 200 tax preferences that Treasury estimates result in more than $1T of uncollected potential Federal income tax, more than a quarter of the $4T that is collected.

Share of Spending

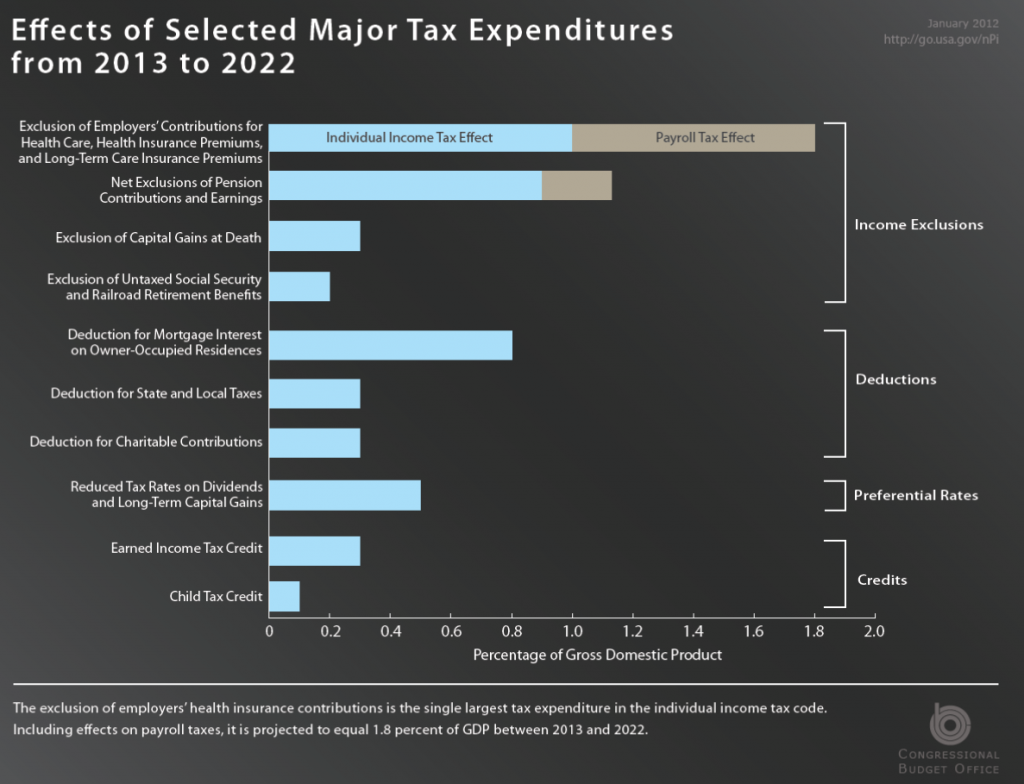
The next chart shows the major tax exemptions.  The Joint Committee on Taxation (JCT) and CBO estimates are lower than Treasury’s but still enormous:

  • They total more than $800B in 2012.  That is more than spending on Social Security, defense, or Medicare.
  • They will total nearly $12T in the decade starting in 2013, which is 5.8% of GDP.

CBO tax-expenditures

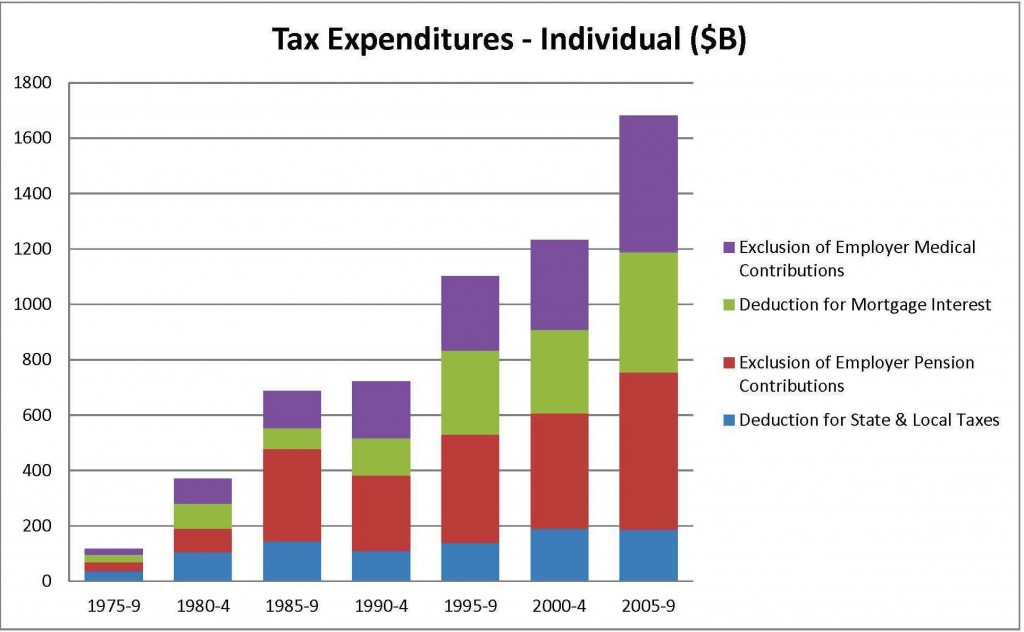
The largest tax expenditure is exclusion of employer contributions for health care.  Employees who get this benefit do not pay tax on its value.  It is projected to equal 1.8% of GDP over the 2013–2022 period.  Next largest is exclusion of pension contributions and earnings, estimated to total 1.1% of GDP over that period, then deduction for interest paid on mortgages projected at 0.8% of GDP, preferential rates on dividends and long-term capital gains at 0.5% of GDP and the earned income tax credit for some low-income workers at 0.3% of GDP between 2013 and 2022.   The rate of growth in value of the exemptions differs.  The deduction for state and local taxes has remained fairly flat even since 1980-4 while exclusion of employer pension and medical contributions has substantially increased.

Tax Expenditure Trends - Individual

Tax expenditures were almost invisible before 1967, when Treasury Assistant Secretary Surrey originated a list of “government spending for favored activities or groups, effected through the tax system rather than through direct grants, loans, or other forms of government assistance”.   He wanted to make them visible because tax expenditures have almost exactly the same effects as traditional spending programs on the budget, resource allocation, relative prices, and the distribution of income.   Economist David Bradford pointed out that if arms manufacturers got tax credits from the Pentagon instead of cash, that spending would not show up in the Defense budget, tax revenues would fall by the same amount, and yet government would be doing the same thing.  Only the accounting would change.

Who benefits from tax exemptions?  The following table and charts are drawn from data in the December 2008 Tax Policy Center paper, “How Big Are Total Individual Income Tax Expenditures, and Who Benefits from Them?”

Distribution of Impact Tax Expenditures Table

The exclusion of employer contributions to pensions primarily benefits those with the highest incomes.  Those in the top 20% of income get an average of 2.34% more after-tax income, for example, than they would without this exclusion.  Lower rates on capital gains than ordinary income and deduction of mortgage interest, state and local taxes and charitable contributions also offer most benefit to those with the highest incomes because they have the highest marginal tax rates.  All but the bottom 20%, however, get 1.4% to 2.16% more than they would without the exclusion of employer health care contributions.  The earned income tax credit (EITC) is the only one that significantly benefits the bottom income group, as it is intended to do.

Only the EITC is overtly aimed at a specific income group.  The others are spoken of as if they benefit society in general but they in fact benefit primarily the top 20%.  Some disproportionately benefit only those in the top 1% income group.  If providing special benefits to the top 1% or 20% was defined as our national policy, it would presumably not be favored by the majority.  But the objectives of our tax system are not defined and its special benefits are almost invisible.

The next post in this series will explore business taxes and some ways they can interact with personal tax.  That is confusing.  Partners in firm’s like Romney’s Bain Capital, for example, get taxed on investment profits at the 20% capital gains rate not the 39.6% top ordinary income rate even if they only manage others’ investments.  Executives of large corporations can defer payment of income so it is not taxed in the year it was earned.  And so on.

My intent in this and the next post is to give an overall sense of some positive and negative aspects of our current tax system for different income groups and for individual, corporate and other legal entities.  These and the two previous posts are background for an exploration of goals we might set for a tax system and the pros and cons of some potential changes.

An “Election Government” for Nepal

Nepal has been without an elected government since May 27 last year.  Its politicians have been fighting ever since about who should lead the interim government necessary so there can be an election.

The four major parties have at last reached an agreement.  They want an “election government” led not by a politician but by Chief Justice Regmi.  Leaders of the UCPN (Maoist), Nepali Congress, CPN-UML and Madhesi Front just signed an 11-point political agreement to form an “interim electoral council” made up of 11 former civil servants.  This is because the NC and the UML would not agree to elections under the UCPN (Maoist) Baburam Bhattarai-led government.  President Ram Baran Yadav approved the agreement and has administered the oath of office to Regmi and two ministers.

The election of a new Constituent Assembly to complete drafting Nepal’s new Constitution will, they say, be held by June 21st.  But the “interim electoral council” will get a second term to December 15th, 2013 if it fails to hold the elections due to ‘any technical or untoward situation’.

Twenty two smaller parties represented in the dissolved Constituent Assembly, including the CPN-Maoist that recently split off from the UCPN(Maoist), rejected the idea and said they will launch protests.  The new Prime Minister should be from within the parties, they say.  Of course, it should not be Baburam Bhatterai the acting Prime Minister since last May 27.

The interim Cabinet will be responsible for holding the elections and overseeing day-to-day administration but will make no decision that could have a long-term impact.

Should we be optimistic?  Why not?  But we should also keep in mind that, ‘this is Nepal, so anything can happen”.  Or nothing can continue to happen.

Who We Tax

What and how much our Federal, State and Local governments tax is summarized here.  Now, who pays what fraction of the total?

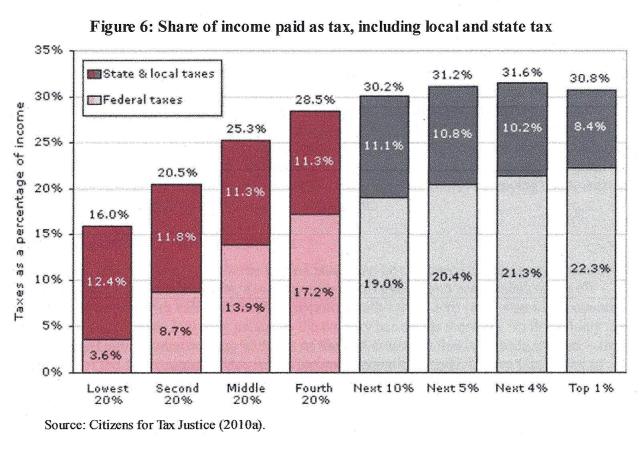
We’ll start with people, then corporations.  This chart shows what % of total taxes is paid by each income group.  The lowest 20% who average about $12,400 per year, paid 16% of their income in taxes in 2009.  Less than 4%, a quarter of their total, is income tax.  The rest is sales and other kinds of tax.

The next 20% who average about $25,000/year paid 21% of their income in taxes, about 40% of their overall tax being income tax.  The middle 20% who average about $33,400/year paid 25% in total.  The next 20% who average about $66,000/year paid 29%.

The top 20% is broken down in more detail.  The lower half who average about $100,000/year pay 30% and the next 5% who average $141,000/year pay 31%.  The next 4% who average $245,000/year pay 32%.   The top 1% who average $1.3 million/year pay 31% of their income to taxes.  This means that while a higher percentage of total tax is paid by each group in the bottom 80%, the rate of increase then slows and the top 1% pays less than the 9% below and little more than the 10% below them.

Wealth, Income and Taxes - 9

What may be more surprising is the share of total tax paid by each group relative to its share of total income.  The top 20% gets 59% of all income and pays 64% of all taxes.  The bottom 20% gets 3.5% of all income and pays 2% of all taxes.  The top 20% pays a greater share of taxes than they receive of income, but the ratio is not very different across the entire range of incomes.

Wealth, Income and Taxes - 10

What is the result of total taxes on each income group?  The Dept of Health and Human Services determines eligibility for federal programs using thresholds below which families are considered to be “lacking the resources to meet the basic needs for healthy living; having insufficient income to provide the food, shelter and clothing needed to preserve health”.  The Census Bureau reported 16% of Americans below the poverty threshold at the end of 2012.

US_poverty_rate_timeline

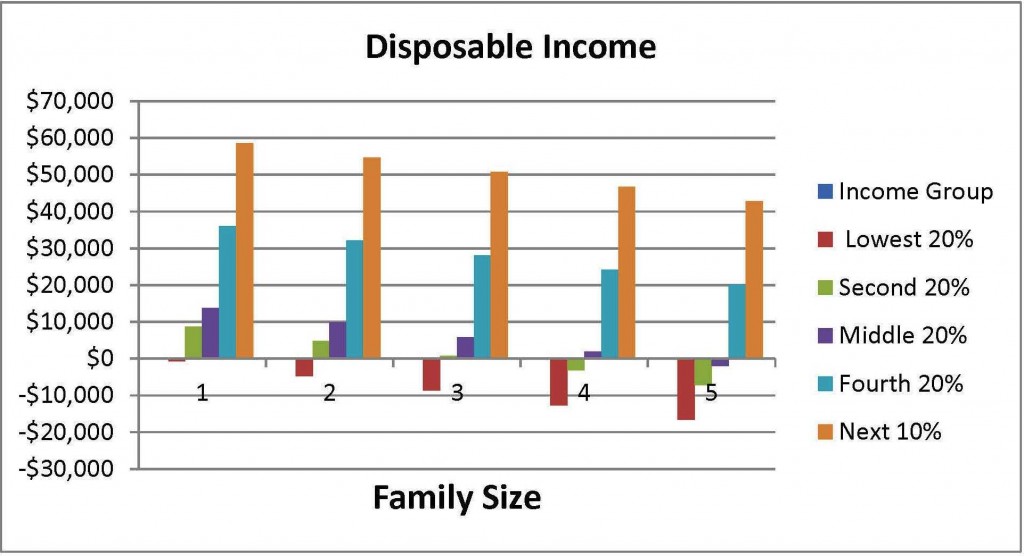
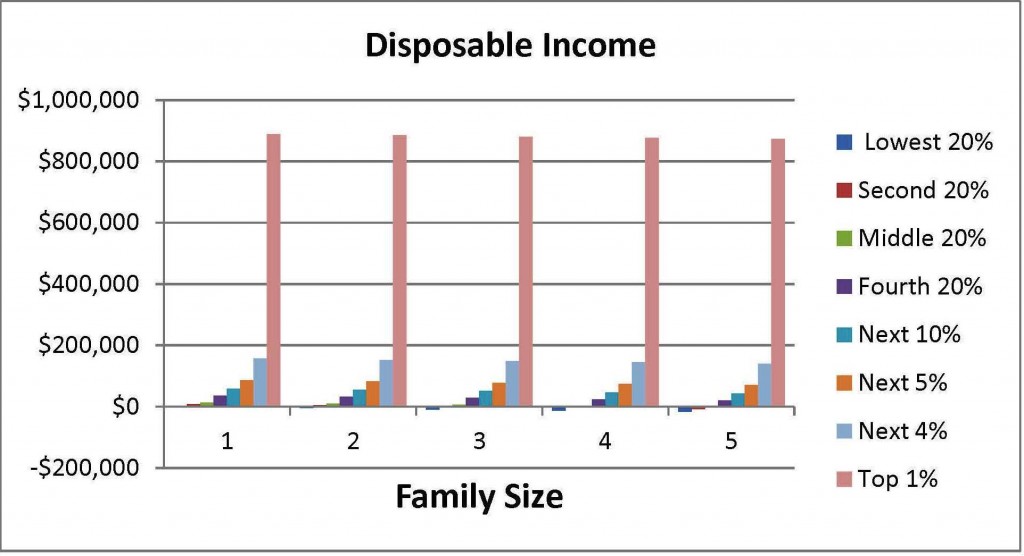
The following table shows how average post-tax income of each income group compares to what I call “disposable income”, the difference between the poverty threshold and the average post-tax income of each group.  A single person in the lowest 20% group, for example, with a pretax income of $12,400 who pays that group’s average of 16% in total taxes has a post-tax income of $10,416, which is $754 less than the $11,170 poverty threshold for a single person.  If they had a spouse and their joint post-tax income was the same $12,400, their post-tax income would be $4,714 less than the poverty threshold.  A family of four in the second 20% would be $3,175 below their poverty threshold.  Even in the middle 20% a family of five would be living in poverty.

Income by Quintile Table_Page_1

The first of the following charts highlights the result of total taxes on the lower income 90% of Americans, the second gives a sense of the very high disposable income available to the top 1%.  In a future post I will examine what distribution of wealth Americans believe is desirable.

Income by Quintile Chart 1

Income by Quintile Chart 2

Turning now to corporations, we know they, too, pay varying combinations of income, social security, property and other taxes.  I suspect their share of total taxes and total income has a similar pattern as for individuals but I have not found the necessary data to know.  Corporations have recently grown enormously more profitable, especially large multinationals.

Corporate Profits after Tax

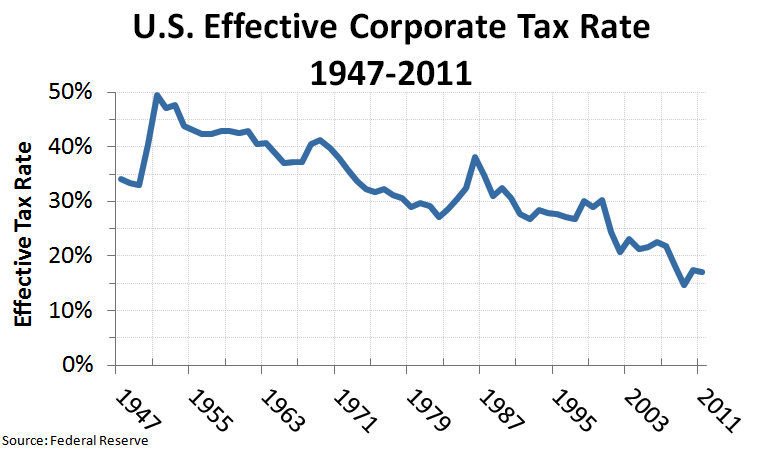
The effective corporate  tax rate has fallen pretty steadily from 50% at the end of WW2 to 17% now.  Since there are ways not available to smaller businesses that large multinationals can use to avoid tax, I expect the effective tax rate would be much lower for large corporations.

US_Effective_Corporate_Tax_Rate_1947-2011_v2

This is not an academic exercise so I will not try to quantify total tax rates paid by corporations categorized by their income size.  It will be more illuminating to explore in the next post what we do not tax – exemptions, deductions and so forth – and how what we do not tax impacts different income groups.


What We Tax

Our tax system is a lot like Topsy in “Uncle Tom’s Cabin”, who says: “I s’pect I growed. Don’t think nobody never made me.”   It growed item by item, legislative session by session, with no defined goal.   What if we had a tax goal and a budget management plan?

This is the first in a series of posts about our current system and its results.  What can be taxed falls into these major categories:

  • Income, what people and corporations earn (e.g., income tax, social insurance programs)
  • Wealth, what people own (e.g., annual real estate tax, inheritance tax)
  • Consumption, what people buy (e.g., sales tax added to restaurant bill or embedded in gas price, value added tax paid at each step from raw materials through manufacturing and retail to end user)
  • Usage of public goods (e.g., road and bridge tolls)
  • Financial transactions (e.g., stock sales)

Our current system is complex for both structural and political reasons.  We have three levels of government, each of which must fund its spending.  That’s the structural cause.  Politics is far greater.  Politicians legislate what revenue will be collected, e.g., income tax rates, and what will not, which they call tax preferences.  They are popular while increases are not, and they can at the last minute be attached without debate to other legislation.   No wonder we have so many – the Federal tax code alone grew in the past 10 years from 1.4M to 3.8M words.

Mistakes and cheating are inevitable with such a system.  And complexity leads to high costs.  The IRS estimates taxpayers and businesses spent over 6B hours in 2008 complying with filing requirements, the equivalent of 3M workers who would have been paid $163B.  That would have been 11% of total 2008 Federal tax revenue.

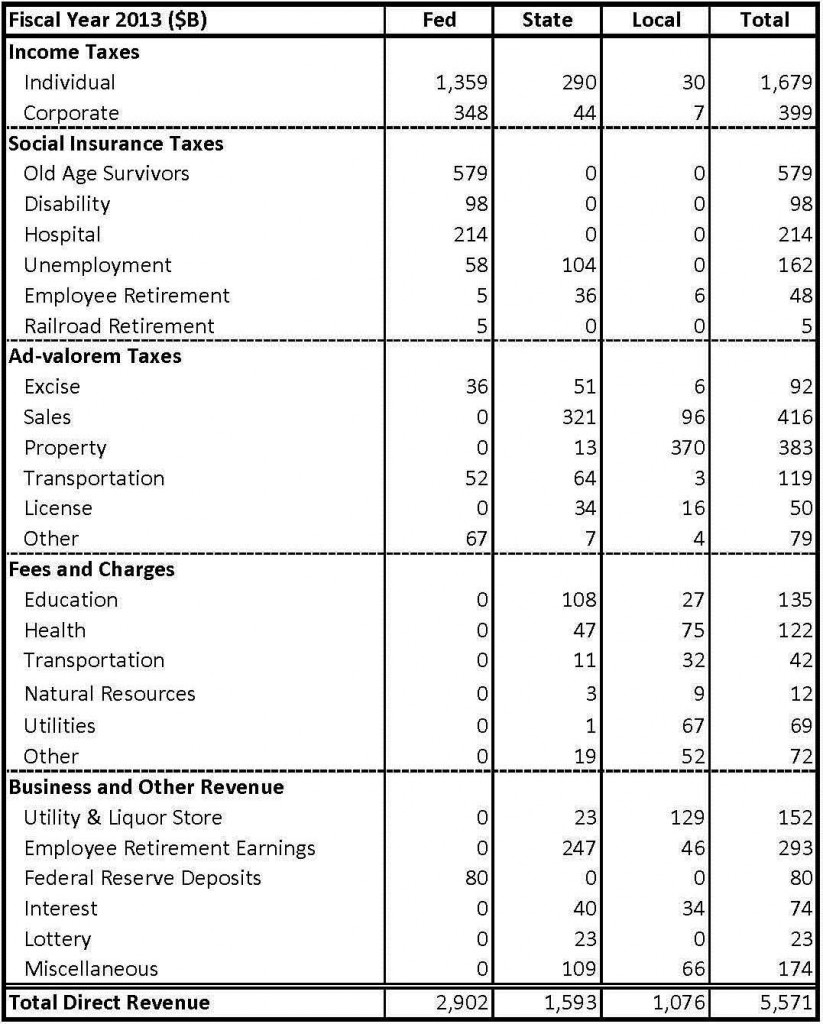
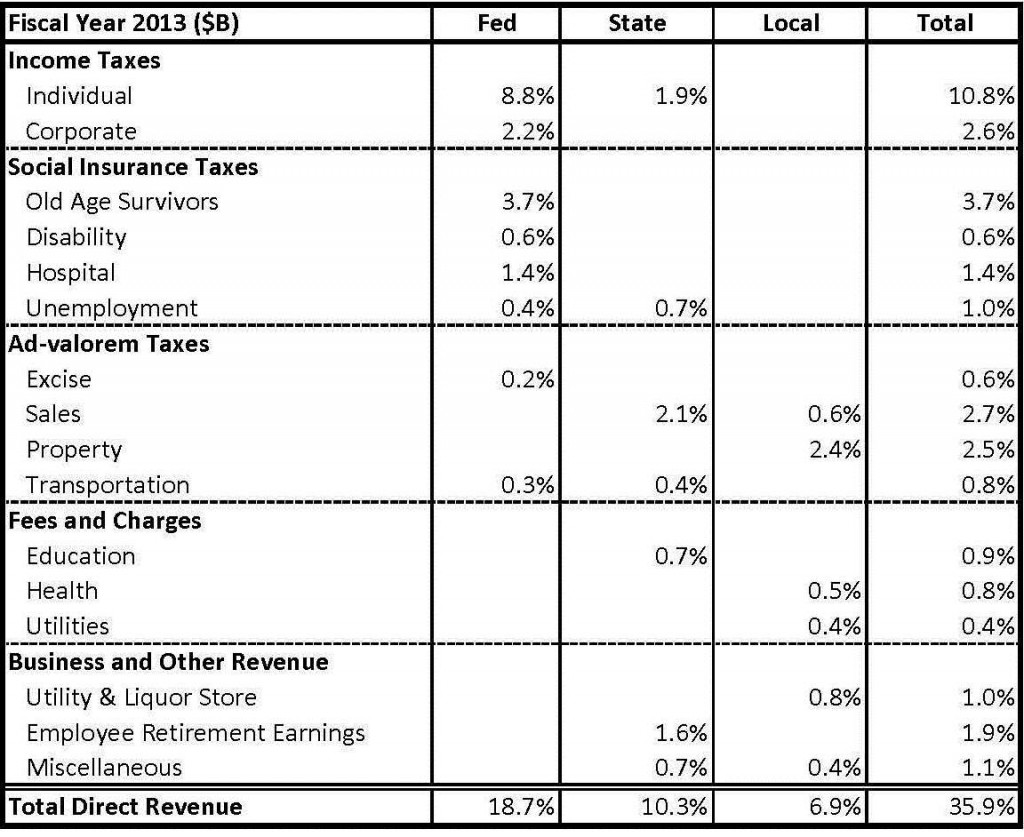
How much do we currently tax at each level of government?  The following data (unfortunately structured a little differently from my categories above) comes from this excellent site:

US Gov Revenue FY 2013 - 1

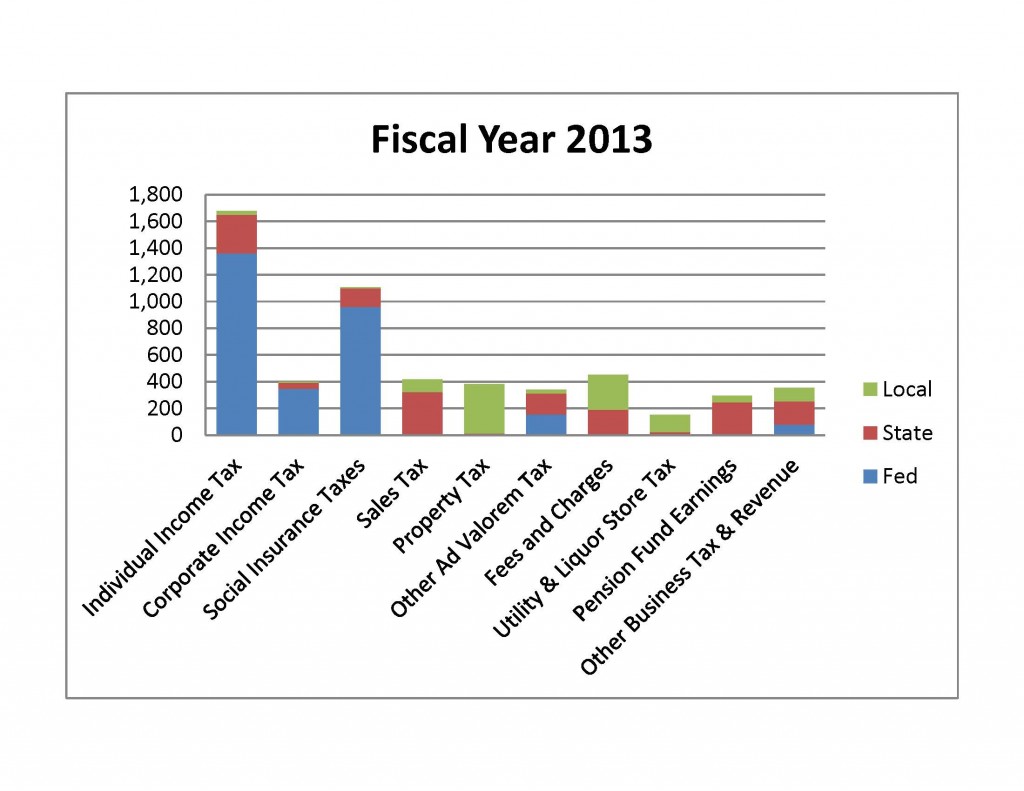
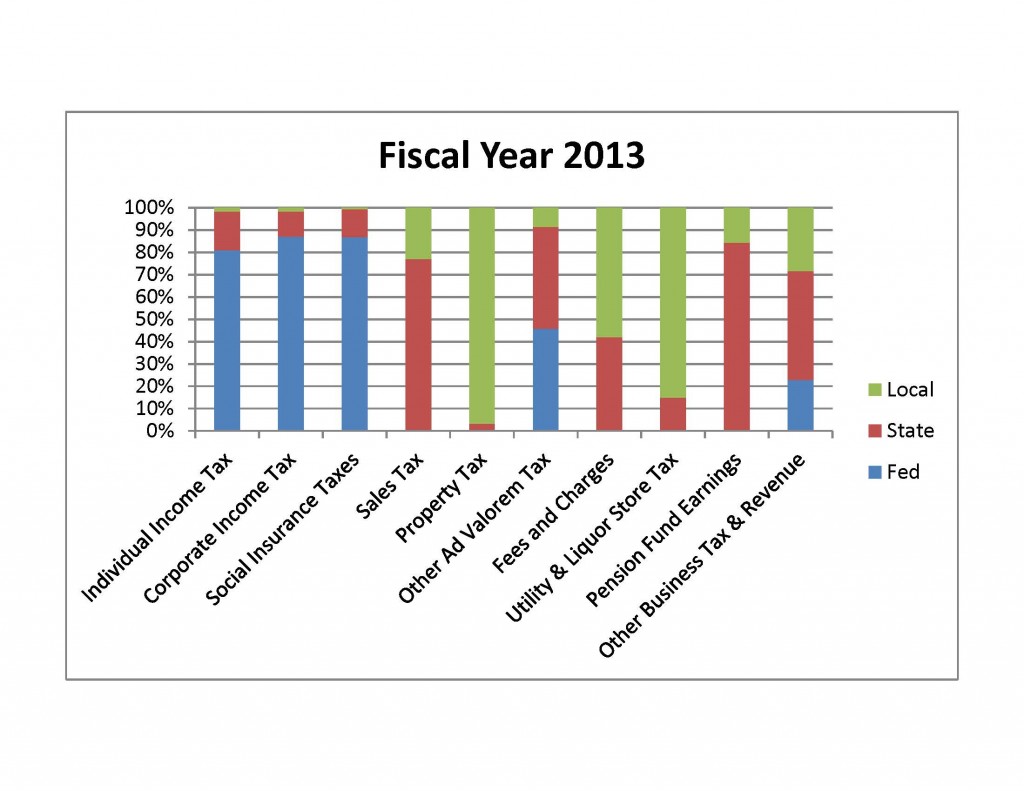
Total tax revenue for 2013 is expected to be around $5.6T, 52% of which or $2.9T will be Federal, 29% or $1.6T State, and 19% or $1.1T Local taxes.  Less than a third (30%) of the total will be $1.7T of individual income tax, 80% of which will be Federal.  Corporate income tax at $399B will be only 7% of the total.  Social insurance taxes totaling $1.1T will be 20% of the overall total.  Another 20%, $1.14T, will be “ad valorem”, i.e., real estate and personal property tax, sales tax, inheritance tax, etc. levied chiefly by State and Local governments.

These charts make it easier to see what taxes are collected by each level of government.

All Gov't Taxes - 2013 - 5

All Gov't Taxes - 2013 - 4

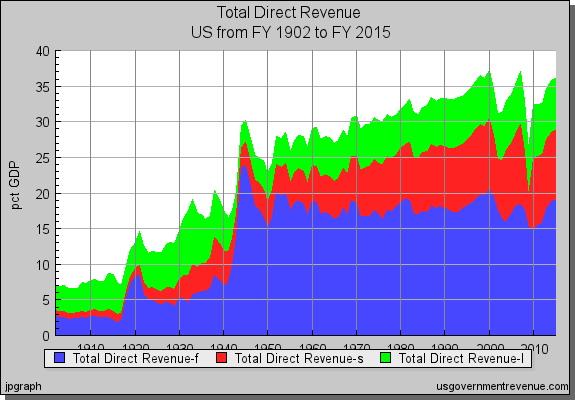
How has tax changed over time?  Total government revenue grew from 7% of GDP at the start of the 20th century to 36% now, about where it was in 2000.  At the start of the 20th century Federal tax was 3%, State 1% and Local 4% of GDP.  Driven by WW1, Federal spiked to 8% and total revenue to 15% of GDP, then Federal dropped back to around 5% through the ’20s.  The Great Depression drove total tax back up to 19% in 1933, of which 6% was Federal, 4% State and 9% Local.  WW2 drove a huge spike to 30% of GDP in 1945, dominated by Federal at 24%.  Federal dropped to 16% of GDP by 1950, jumped to 20% in the Korean War and stayed mostly in the high teens since then.  State revenue hit 8% in the 1982 recession and now fluctuates between 8% and 10%.  Local revenue hit 6% in 1982 and now fluctuates between 6% and 8%.

Wealth, Income and Taxes - 4

What was taxed also changed.  At the start of the 20th century the Federal government got its revenue chiefly from import tariffs while State and Local governments levied property taxes.  Income tax was established in 1913.  It went to 5% of GDP following WW1, settled around 2% through most of the ’20s and ’30s, spiked to 16% in 1944 and settled between 11% and 12% thereafter.  Sales and other point-of-transaction taxes doubled from 5% or 6% at the start of the 20th century, peaked in the Great Depression at 14% then dropped to 10% by 1960 and 7% now.  Fees and charges grew slowly to 1% until WW2 then faster to 3% now.  Social insurance taxes established in 1937 to fund Social Security were less than 1% in the first year, grew to around 10% in the 1980s and are now 6% to 7% of GDP.

Wealth, Income and Taxes - 5

Federal revenue is now chiefly from income and social insurance taxes.  State revenue was mainly ad valorem until the ’70s although they began collecting income tax in the ’20s and social insurance in the ’30s.  It is now about equal thirds income tax, ad valorem, and fees plus business and other revenue (56% of which is earnings on pension investments).  State income taxes rose sharply in the ’70s and ’80s, then flattened.  Local revenue is about half ad valorem taxes, half fees plus business and other revenue (40% of which is from water and electric utilities).

US Gov Revenue FY 2013 - 3

Now we know what we tax and how it changed in the past century we can in the next couple of posts see who pays what % of the total and what taxes we intentionally do not collect.

Highlights so far include:

  • Total tax grew steadily as a % of GDP for half a century following WW2
  • Total tax peaked in 2000 and is now at the same level but it has twice fallen very sharply
  • Almost half of all tax revenue is collected by State and Local governments
  • Less than a third of the total is personal income tax
  • Income tax has been quite steady around 13% of GDP since WW2
  • Sales and property taxes are around the same level as corporate income taxes
  • Social insurance tax is pretty steady at 6% to 7% of GDP (but health care spending is fast increasing)