The Dukes of Moral Hazzard

In the world of finance, moral hazard exists when someone can profit from successful bets and suffer little or nothing from bad ones.  In the 1980s Dukes of Hazzard show the Duke boys, their beefed-up Dodge Charger and their short-shorted cousin Daisy keep foiling corrupt county commissioner “Boss” Hogg’s scams but because the well-meaning boys often bail him out, he’s always coming up with new scams.  So it has been in the world of finance for the last three decades.

Daisy Duke

Moral hazard inflated the bubble whose collapse in 2007 left us wallowing in the Great Recession.  Wall Street executives made bets that profited them immensely expecting, correctly, they would not suffer when the bubble blew.  Their firm might suffer, perhaps even cease to exist, but they would keep their profits.  Their firm might pay penalties for law-breaking, but they would not.  Moral hazard defeats what finance should do, allocate capital where it will have most value and efficiently reallocate risk.  This post examined finance’s mechanisms – securities, credit and insurance – and the following one highlighted regulatory changes enabling the mechanisms to be used in ways that led to the 2007 financial crisis.  This post explores how Washington became Wall Street’s savior.

Bailouts of individual enterprises started in 1971 when defense contractor Lockheed  was rescued from financial mismanagement with $250M of loan guarantees.  Then in 1973, the Penn Central Railroad, which declared bankruptcy in 1970 but was considered “too big to fail”, was merged by Congress into Conrail, whose operating costs Congress spent $7B subsidizing.  Next, in 1980, Chrysler was bailed out with $1.5B in loan guarantees.  So, with these bailouts starting in 1971, Washington began thwarting capitalism’s creative destruction.

Lockheed was mismanaged financially, its defense and civilian mega-projects had big cost overruns and were late, and it was bribing foreign government officials.  Penn Central’s executives utterly failed to gain operational control after it was formed in a 1968 merger.  Chrysler’s executives produced its uncompetitive cost structure and low quality products.  If, to take just one example, Chrysler had declared bankruptcy, its management would have been replaced and its contracts renegotiated.  Because it was not restructured, it inevitably failed again and leaders of GM, Ford and the unions learned they, too, might expect to be bailed out.

The Chrysler bailout, the first whose rationale was to save jobs and the economy, set an especially bad precedent.  In 1987, the Fed took the next step along that path of unintended consequences which led to the 2007 financial collapse.  The Fed’s traditional mission had been to manage inflation and promote sustained output growth by supervising credit.  Now it began trying to manage asset prices.

When the Dow plunged 23% on October 19, 1987 following drops of 4% and 5% the previous week, the Fed promised before the market opened the next day to “serve as a source of liquidity to support the financial and economic system”.  No economic event had triggered the crash.  Stock prices had simply risen too far too fast, 40% in the first eight months of the year, and there was panic at the first sign of the bubble deflating.

Why, then, did the Fed do anything?  Because Fed Chairman Greenspan saw market prices not as an indicator of the economy’s health but as something he should manage.

Market prices kept heading up through the 1990s following each downward blip, e.g., the LTCM hedge fund collapse and bailout in 1998, until in 2000 the dotcom bubble collapsed.  Greenspan then began cutting interest rates almost month to month from 6% in January 2001 to 1.75% by year-end, and he kept on down to 1% in 2003.  Consumer spending, around 70% of the entire US economy, had barely dropped; only the stock market had plunged.  Greenspan’s unprecedented rate-cutting was not required to stimulate economic growth but stock prices, which it did until the next collapse.

Interest from investment was now so low that it became essential to speculate for income – trust funds and foundations must disperse 5% of assets each year.   And speculation seemed safe because a new pattern had emerged; when bubbles collapsed, the Fed would save the day.  So houses, traditionally a safe investment, became a vehicle for speculation.  Until that bubble collapsed in 2007.

The Fed was not the only creator of moral hazard.  Congress, in the 1995 Securities Litigation Reform Act to control nuisance class action lawsuits, exempted accountants from liability for fraud by their clients.  Accounting scandals soon followed.  Enron was the most dramatic and its 2001 fall also took down its auditor, Arthur Andersen, one of the “Big Five” accounting firms.

The SEC’s contribution to the 2007 crisis was facilitation of stupidity.  From 1975, the SEC limited investment bank borrowing to no more than $12 on each $1 of their capital.  In 2004 they gave the five biggest ones a special exemption that allowed them to lever as much as 40:1.  Three years later, all five of them were insolvent.  First, Bear Stearns went belly-up in a bank run when clients fearing it was over-leveraged pulled out 90% of its liquidity in two days.  Almost immediately after that Lehman Brothers became the largest bankruptcy ever in the USA.

Bear was eased into the arms of JP Morgan with $29B of guarantees from Washington.  Lehman was allowed to fail.  Its clean assets were bought by Barclays and others.  But then Washington stepped in full force.  Merrill Lynch was helped to sell itself to Bank of America.  Morgan Stanley and Goldman Sachs borrowed massively from Washington and changed their status to commercial banks so Washington would lend them more.  The Fed bailed out AIG whose massive exposure to derivatives made it “too big to fail” and Secretary of the Treasury Paulson, ex-CEO of Goldman Sachs, nationalized Fannie Mae and Freddie Mac for the same reason.

Why were these economy-threatening institutions allowed to grow so big?  Deregulation of the barriers was strongly advocated throughout the 1990s by Treasury Secretary Rubin, formerly co-chairman of Goldman Sachs.

And why were economy-threatening derivatives not regulated?  Rubin’s advice was instrumental in that decision, too.  He later became a director and temporary chairman of Citigroup.

When asset prices tumbled as the real estate bubble collapsed, banks had to stop lending, not that there was much demand for new borrowing.  It was said to be a liquidity crisis because the big banks were, or were close to being, insolvent.  The confusion led to a Wall Street crash.  In that panic, Treasury Secretary Paulson proposed a $700B program to inject capital into the big banks and buy the junk off their books while the Fed began far more massive capital injections via all the big banks.

Pretty soon Washington (the Fed, FDIC, Treasury and FHA) had a $15T commitment of monies spent, lent, and guaranteed, around the size of the entire US economy. Much of what was lent has since been repaid because the big banks were saved and many of the guaranteed loans were sound.  Nonetheless, the cost looks likely to end up in the range of $1.5T to $3T.  Those numbers are too large to imagine.  For comparison purposes, the inflation adjusted cost of WW2 was around $3.5T.

And saving the banks but did not avert global economic recession.  Furthermore, the saved big banks are still too large to fail and their executives are still profiting as they did before when, for example, the CEO of Citibank was paid $130M from 2003 until late 2007 when Citi’s stock collapsed from 55 to 2.

I’ll explore in the next post why the people who wreaked such destruction on their employers got to keep their enormous rewards and why although their employers later had to pay big penalties for fraudulent actions on their watch, none of the executives has been indicted.

The Tent of Sherlock Holmes

Sherlock Holmes and Watson pitch their tent and go to sleep.  Hours later, Holmes jogs Watson awake and commands: “Look up and tell me what you see.”  Dutifully, Watson gathers his thoughts.  “I see countless stars,” he begins, “in the immeasurable vastness of the heavens.”  He ponders how tiny he and his friend are in comparison and can say no more.  “What is it you see, Holmes?” he asks.  “I see some scoundrel stole our tent.”

Watson sees the concept he always sees, Holmes sees what changed.   This post examined finance’s mechanisms – securities, credit and insurance.  Now we can focus on what changed to make the 2007 economic collapse possible.  Because human nature did not change, we will defer to a future post how what did change was exploited.

The combination of several changes led to the 2007 perfect financial storm.

The root cause was the Basel I agreement in 1988 which, following the messy liquidation of a German-based bank, set minimum capital reserve requirements for all G-10 banks based on the relative risk of five classes of assets.  Domestic sovereign debt required zero reserves, corporate debt 8%, intermediate types 0.8%, 1.6% and 4%.  Residential mortgages required 4%.  That got bankers thinking.  How could they keep making more loans without increasing their capital reserves?

Mortgage securitization was the first answer.  It had been developed in small steps associated with the growth of Fannie and Ginnie Mae then heavily promoted by Washington in response to the 1980s Savings and Loan Associations (S&L) crisis.  Very high interest rates established to quell inflation had caused almost a quarter of Savings and Loan Associations to fail.  Securitization attracted big investors and helped stabilize the residential mortgage market.  Now commercial banks began using securitization to get mortgages off their balance sheets so they would need no corresponding capital reserves.  They could keep the origination fees and keep issuing more mortgages.

Capital reserves could also be avoided using Citigroup’s 1988 invention of off-balance-sheet entities, e.g., SIVs, Structured Investment Vehicles, which at their 2007 peak had over $400 billion of assets.

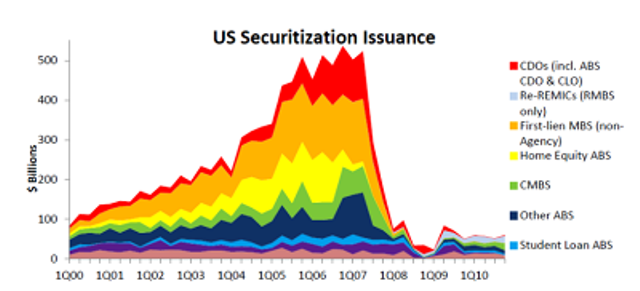
The new mechanism for securitizing mortgage loans, the Collateralized Debt Obligation (CDO), was invented in 1987 by now-defunct Drexel Burnham Lambert to securitize mortgage-backed loans for a savings institution that later became insolvent.  Their issuance exploded to more than $180 billion by Q1 2007.  The credit quality of CDOs declined as subprime and other non-prime debt grew from 5% in 2000 to 36% of CDO assets in 2007 but the credit ratings of CDOs did not change.

Rating agencies ignored the risk of a nationwide collapse of housing values when giving CDOs the highest grade.  They also tended to give high ratings to all CDOs because they were paid for those ratings by the CDO originators.

CDOs are complex instruments.  Investors worried about the risk of default on the underlying loans.  The answer was JP Morgan’s 1994 invention of the Credit Default Swap (CDS).  In return for a small payment, the buyer of a CDS would get the full amount of the loan if the borrower defaulted (the seller of the CDS would get possession of the loan).

A CDS is different from an insurance contract because it pays off  whether or not the CDS buyer suffers an actual loss.  Unlike life or fire insurance, you can buy a CDS on a loan made by someone else.  More dangerous, the seller of a CDS is not required to have capital reserves.  And there was no oversight because CDSs are not traded on an exchange and there is no required reporting of transactions to a government agency.

Credit Default Swaps soon came to be used for purposes very different from risk mitigation.  For a small outlay you could buy a CDS to collect the entire face value of a CDO if it collapsed.  Multiple CDSs could be stacked on the same CDO and CDOs began to be collateralized by other CDOs.   It was easy to see that betting against CDOs whose underlying loans would default could generate big profits, and if you borrowed enough money to make huge bets your winnings could be gigantic.

Speculative frenzy drove the total “value” of outstanding Credit Default Swaps over $60 trillion by the end of 2007, four times as high as GDP, almost the size of the entire global economy.

Meanwhile, the Fed was holding interest rates very low to maintain investor confidence after the dotcom bubble’s collapse in 2000-2001.  That enabled lower income buyers to enter the housing market, encouraged refinancing and led to lower and lower underwriting standards that culminated in NINJA (no income, no job, no asset) loans to people who would inevitably default, but not within the 90 days it took to securitize and resell their mortgage on which the originator would keep the origination fee.

The last regulatory change for the perfect financial storm is the Fed’s relaxing of the 1933 Glass–Steagall Banking Act which limited banks’ size and barred commercial banks from securities activities.  Looser “interpretation” of the Act that began in the early 1960s was far advanced by 1998 when Citibank merged with Salomon Smith Barney, one of the largest US securities firms.  In 1999 the Act was repealed altogether.

The financial system was soon dominated by behemoths.  In 1990, the 10 largest US banks had almost 25% of the industry’s assets.  That grew to 44% in 2000 and almost 60% in 2009.  The two biggest banks in housing finance had 44% of US mortgage originations in 2009.  Oversight, or indeed management, of these giants whose operations are global, complex and opaque became, and still is, little more than a hypothetical possibility.

When the $22T housing bubble burst in 2007, around $5T was very rapidly lost.  Financial institutions had too little capital reserved to cover such a loss and unknowable inter-dependencies.  They had traded so much with each other that failure of one would likely bring down others.  The CDS insurance sold by AIG and others to mitigate the risk was useless because they had no reserves to compensate those whose assets were suddenly worthless.

That was when the final change took effect, a non-regulatory one.   In 1998, Long-Term Capital Management, a hedge fund that used 100:1 leverage to buy over $100B of emerging market bonds and $1T of derivatives, had lost $5B when Russia defaulted on its debt.  Fearing market panic, the Fed pressured the banks that lent the $100B to buy LTCM’s assets so it could be promptly liquidated.  Wall Street executives learned from that event.  They would likely be bailed out, too, if their bad bets were big enough to shake the markets.

When the banks and shadow banks bets did go bad in 2007, Washington stepped in with $2 trillion of tax-payers’ money to halt what was fast shaping up to be a potentially economy-wide bank run.

Financial institutions had come under stress because of bad bets, which their high leverage turned into a crisis with potentially huge domino effects.  We cannot know how serious the results would have been if the crisis had been allowed to play out.  We do know the leaders of the giant financial institutions got the one critical bet for their own future right, the Federal Reserve and Treasury did bail them out.

I will next explore how that financial moral hazard developed; how Washington came to be Wall Street’s savior and made financial and economic crisis inevitable.

Mr Economy’s Paralyzing Stroke

Finance is like the circulatory system distributing oxygen and nutrients through the human body, stabilizing its temperature, and so on.  It’s prone to strokes.  What led to Mr Economy’s massive one in 2007?  Will he have more?  How severe will they be?  And will he ever recover from the paralysis that one caused?

Our economy depends on finance to flow.  Unfortunately, Washington has the wrong model.  When the flow stopped in 2007 they applied giant plungers, TARP and Quantitative Easing, to what they imagine is a blocked financial toilet.  Not surprisingly, the flow has not been restored.

To understand what led to the cerebrovascular accident and what risk factors to change, we must first know the purpose of finance, what it should do, and its basic mechanisms.   Its purpose is to help people save, manage, and raise money.  What it should do is allocate capital where it will have most value and efficiently reallocate risk.  Its mechanisms are securities, credit and insurance.

We need to know how those mechanisms work to understand how and why the circulation of finance got interrupted.

Securities can be bought and sold.  Their traditional function is for commercial enterprises to raise new capital from investors who seek income and/or capital gain.  Their traditional categories are equity and debt.  Equity securities represent fractional ownership of the issuer, debt securities a loan.  Debt securities typically require regular interest payments and the issuer must repay the loan.  Equity securities are not entitled to payment but may receive a periodic share of the issuer’s profits.  Equity owners hope the value of the issuer, and therefore their securities, will increase.

Credit has traditionally been supplied by bank loans governed by an agreement between issuer and borrower.  Those loans could not be traded.  The issuer received interest payments for the use of their capital and protected against failure to repay with a claim on the borrower’s assets, i.e., collateral.

Insurance transfers the risk of a loss from one entity to another in exchange for a payment.  The insured accepts a definite small loss in the form of their payment to the insurer in return for compensation in the uncertain event of a larger financial loss.

Several things changed in the past three decades.  There was a great increase in securitization of what was originally credit.  Security, credit and insurance transactions got combined in new and ever more complex ways.  Financial regulation was relaxed and funding of regulatory oversight was cut.

Mortgages (i.e., credit) were bought in bulk, repackaged and resold as new types of securities, CDOs, Collateralized Debt Obligations, Re-REMICs, Re-securitizations of Real Estate Mortgages, ABS, Asset-Backed Securities, MBS, Mortgage-backed Securities and etc.  Banks could now originate more  mortgages because the ones they sold were no longer on their balance sheet.  Buyers of mortgage-backed securities could pay for them with money borrowed against other securities as collateral and hope to resell them for a quick profit.  They could insure against their collateral’s possible loss of value.   And so on and so on.

That increased complexity accelerated the financial system’s growth but also made it more fragile, which increased risk for the overall economy.  Issuance of these new kinds of derivative securities (chains of transactions derived from an asset) exploded from less than $100B in 2000 to more than $500B in 2007.  That’s when the uber-stimulated financial system cratered and Mr Economy had his paralyzing stroke.

US Securitization Issuance

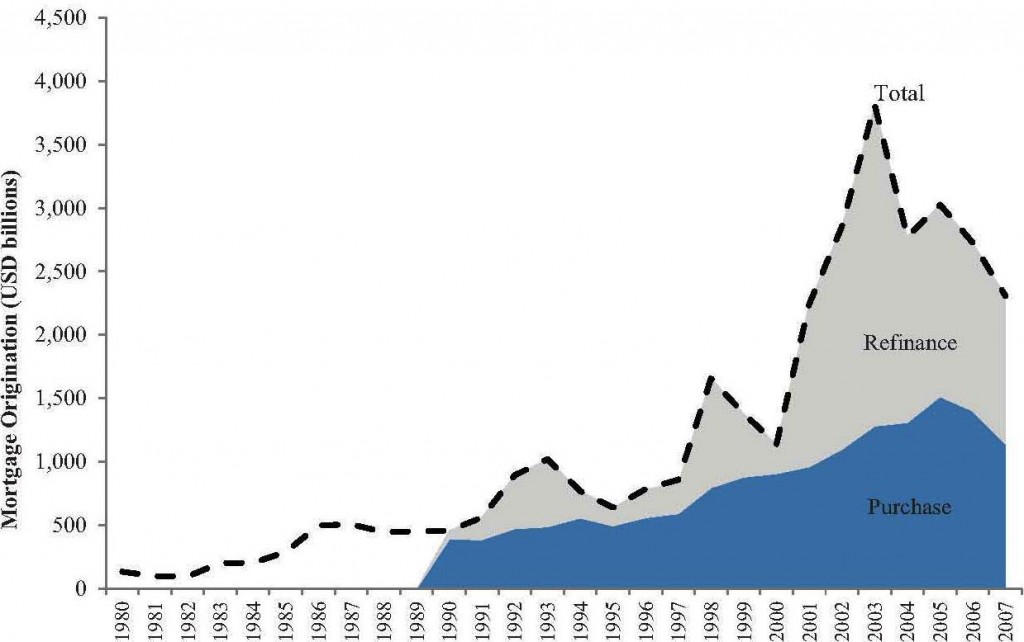
Financing , refinancing and securitizing doubled household debt from 48% of GDP in 1980 to 99% in 2007.  Most of that increase was in residential mortgages, up from 34% to 79% of GDP.

Mortgage Origination

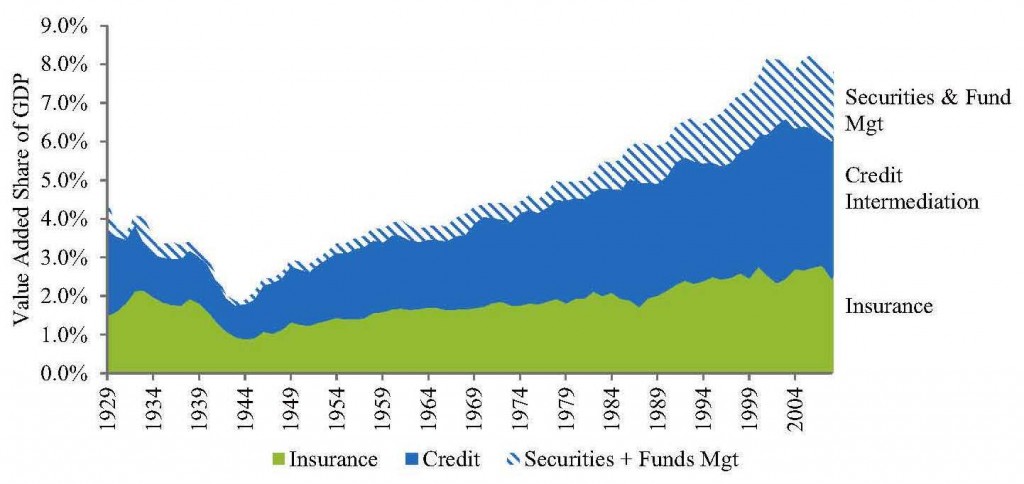
Financial services grew not just from credit intermediation.  Management fees grew as people switched from owning individual securities to managed funds, transferred their assets to professional managements, traded more, and as asset values increased.   Only 25%  of household equity holdings were professionally managed in 1980.  That more than doubled to 53% by 2007.

The growth in insurance was mainly in new kinds of insurance associated with securitization.

Earnings of financial services employees grew rapidly along with the financial sector’s growth.  In 1980, they typically earned about the same as their counterparts in other industries.  By 2006, they earned an average of 70% more.

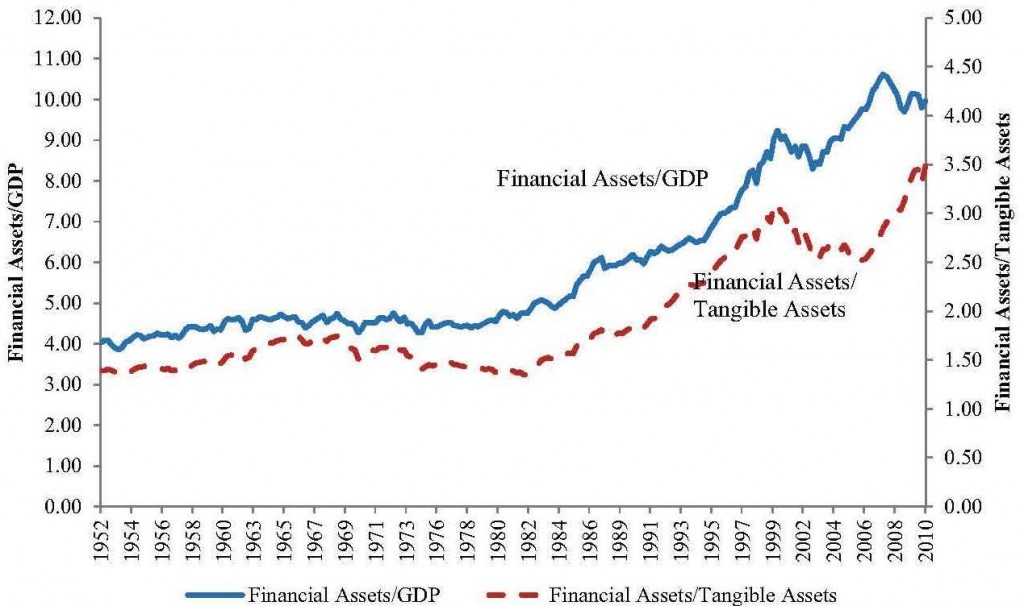
Growth of Financial ServicesThe increase in household debt and associated derivative securities drove the value of total financial assets, stocks, bonds, derivatives, and etc from about five times GDP in 1980 to double by 2007.  The ratio of financial assets to tangible assets, e.g. plant and equipment, land, residential structures and etc. grew in the same rapid way.  Debt creates money because if you lend me $100 there is now $200, my $100 plus your $100 asset, i.e., my promise to repay.  Assuming I do repay.

Financial Assets vs GDP

Much of the asset growth came from securitization of loans on bank balance sheets, i.e., transforming credit into securities.  The total value of debt securities was 57% of GDP in 1980.  Securitization of loans added 58% by 2007.  The total value of debt securities more than tripled to 182% of GDP.

Much of the growth in equity securities came just from higher equity valuations, i.e., the exuberant willingness of buyers to pay more for potential future gain.  The total value of equity securities nearly tripled as a share of GDP between 1980 and 2007, from 50% to 141% of GDP.

Financial institutions traditionally earned spreads on loans on their balance sheets, i.e., they got higher rates of interest on capital they lent than they paid to depositors.  That changed with securitization.  Now they profited mainly from fee income.  By 2007, 61% of home mortgages were in loan pools of mortgage-backed securities, 72% of which were guaranteed by the Federal Housing Administration (FHA) or one of two Government Sponsored Enterprises (GSEs), Fannie Mae or Freddie Mac.

Securitization of credit was a major part of the development of the “shadow banking” system.  Many types of non-bank financial entities now perform some essential functions of traditional banking.  Like banks, they use short-term borrowing to issue or buy longer-term securities.  Their short term lenders can demand repayment at any time, and they are vulnerable to a drop in the value of longer-term securities, either of which can result in the equivalent of a bank run because deposits at shadow banks are not federally insured.

When financial transactions were primarily between a security issuer and a purchaser, or a bank and a borrower, each party’s risk could be known.  When a package of mortgages is securitized, however, third parties buy the securities, insure themselves against severe loss with a fourth party which perhaps insures itself with a fifth party, and so on and so on.  It becomes impossible to assess risk for any party.  Prudently managed entities can be brought down by others in the chain and if large enough ones fail, the economy of which they are part can collapse.  That’s what happened in 2007.

In future posts I will explore, not necessarily in this order:

  • What Washington and Wall Street did that made the collapse inevitable
  • Why Washington bailed out Wall Street’s largest enterprises instead of allowing them to fail
  • Why some Wall Street enterprises were fined for criminal behavior but no executives were jailed
  • What must be done so the financial system will fulfill its purpose

We will, I’m sorry to say, come to see that our financial system that should function as a circulatory system is instead being operated as a Washington/Wall Street mine and we are being poisoned by its toxic waste.  By exploring how that happened we’ll identify essential changes so the system will instead do what it should.  Now, where did I put my hard-hat, flashlight and canary?

Evaluation of War on Terror Strategy

Our War on Terror strategy (see this) implies readiness for large and small scale action in multiple theaters throughout Africa, the Middle East and Central Asia, Southeast Asia, and Northern and Western South America.  How likely is its success, how long will it take, can we afford the cost, and is there a better approach?

The goal of the strategy is to eliminate Islamic “holy war” terrorists who might attack us from anywhere in the world.  It is unachievable.  That kind of threat can not be ended, only mitigated and endured.  Military action is in fact counter-productive because the collateral destruction creates more terrorists and strengthens their support.  Even if we could utterly destroy al Qaeda, we could not declare victory because we declared war on all Muslim terrorists.  Since there are over a billion Muslims, there will always be a few Muslim extremists just as there will always be some who are Christian.

Response to aggression should always be proportional to the threat, and it must be able to succeed.  Our response is massively disproportional and it can never succeed.

A strategy of unending military engagement everywhere would exhaust any nation.  That strategy for the USA predates the War on Terror.  We spend more on military activities than the next 20 nations combined, which is half our total expected Federal tax revenue.  The cost of our already high Federal debt must become unaffordable when our spending is persistently so much higher than revenue.  No nation can afford war that is permanent.  We cannot afford this strategy’s cost.

And the strategy will make us permanently less free.  When we go to war to preserve our liberty, we willingly forgo some of the freedoms we enjoy in everyday life, expecting them to be restored when victory is achieved.  If victory never can be won, those freedoms never will be regained.

Finally, the strategy creates unwarranted suffering for our own people.  Enormously more of our troops are killed than the number of US citizens threatened by terrorists and enormously more of them suffer physical and/or psychological damage from which they will never recover.  Caring for them has a high dollar cost.  Far more important, we are wrong to demand their sacrifice.

So, we are forcing future generations to pay for a war that cannot succeed and which limits the very freedoms we claim it will preserve.  How did this happen?

For the first half century after we emerged as a great power early in the 20th century, we acted overseas only after deliberation and then with decisive power.  The great good fortune of our geography gave us time to prepare and sufficient resources to do so.  We entered WW1 and WW2 when we were ready and we brought about rapid victory.

We radically changed strategy following WW2.  We began managing the world whether or not our immediate interests were threatened in any particular situation.  We took the lead in Korea, which the Allies had split into two nations at the end of WW2.  Then we initiated a long, bloody and fruitless war in Vietnam that spilled over into Laos and Cambodia.  And we established a nuclear strategy of “mutually assured destruction” which we did not change after Soviet Russia, our only military rival, collapsed and we no longer faced any existential threat.

In response to the 9/11 attack on two mainland USA targets by al Queda terrorists, we initiated not just detective work but war, as if we had been attacked by a nation.  We invaded Iraq even though we knew there was no Iraqi involvement in the attacks.  We heavily bombed Afghanistan where al Queda’s leaders were based and inserted ground forces there.  After Al Queda’s command cell relocated to Pakistan, we greatly increased our activities in Afghanistan.  By about 2004 we had lost focus on what our War on Terror was intended to achieve.

No satisfactory reason for our invasion of Iraq emerged, civil war broke out, and opposition to us was so strong by 2004 that we could only maintain our presence by allying with our enemies.  Furthermore, by destroying Iraq’s power we had eliminated the only regional balance against Iran, which we now view as our enemy.  After entering Afghanistan to disrupt al Qaeda’s leadership, we drifted into fighting the Taliban, a different and far more costly objective that required massive force.  We then, as in Iraq, set a far longer term objective, building a democratic society.  When we installed the Karzai government, the Taliban retreated to the mountains to wait us out.  We are now downsizing our presence but the end of our war in Afghanistan is indefinitely far distant.

Meanwhile, we began to capture and monitor all electronic communications to identify terrorists.   Believing we were threatened by potentially massive new attacks, we could only hope to avert them by monitoring all communications between everyone, and storing everything so we could monitor earlier communications of new suspects.  We partially suspended habeas corpus so suspects could be jailed indefinitely without trial.  We began torturing them, illegal in the USA even in wartime, in camps overseas.  We began killing suspects without due process.  The President can now direct even US citizens to be killed.

In the past 10 years we have killed around 3,000 terrorists and civilians with drones in Pakistan, Somalia, Yemen and elsewhere, i.e., inside nations on which we have not declared war, and the Joint Special Operations Command (JSOC), which killed bin Laden, has established commando teams in Africa for operations throughout NE Africa and the Middle East.  Attorney General Holder asserts: “Our legal authority is not limited to the battlefield in Afghanistan… We are at war with a stateless enemy, prone to shifting operations from country to country.”  That authority extends, he says, to killing US citizens without regard to geography or due process.

War changes society by limiting citizens’ rights.  Inspecting the private communications of citizens is routine during war, habeas corpus and due process are routinely suspended, and what would be assassination in time of peace becomes legal.  But if our war on terror never ends, our civil liberties and peacetime rules of law will never be restored.  They will be further eroded.

We are now, 12 years into this war, committing massive resources to missions that are not even clearly connected with preventing Islamist terrorism and we are making permanent what were introduced as emergency overrides on the Bill of Rights, e.g., the need to obtain a warrant for certain actions.

No nation can afford the dollar cost of permanent war or the spiritual cost of war that can never be won.  When we do take military action it should be with clear goals and sufficient force applied in a way that will achieve the goals.  Our present strategy has none of these attributes.

“If You Really Want to End Suffering,

it’s very simple,” Shugen Sensei told us at the start of our week of Zen Buddhist meditation: “Stop creating it.”  I’ll come back to that in a moment.  Just notice he did not say it’s easy.

Thinking why I blog reminded me of what Steve Jobs said is the secret to product development “Start somewhere”.  Just starting has always been my path.  Only later, sometimes much later, if what I started still feels worth doing, do I try to understand why.  The urge to figure out the why of Himalayan exploration, Buddhist practice, economic and governance research and blogging has now arrived.   To my surprise, it centers on ending suffering.

It all started ten years ago in the Himalayan mountains.  It wasn’t my idea to go there and I had no specific objective.  What happened was I found myself among people who appeared to be living with dignity, not aggressively, not hurriedly, and happily without the nice things we take for granted.  Could it be true?  Did they have a recipe my society might learn from?  So I kept going back.

I began to wonder if Buddhism was part of the recipe.   When we visited Buddhist temples our crew always lit lamps and prostrated.  But later, when we visited Hindu temples and the dwelling places of animist spirits, they showed reverence there, too.  I’d done some Buddhist reading by that time and was trying to meditate.  That’s why I went to the Zen monastery.

By the end of the first day I was pretty sure I’d made a mistake.  It was so hard to do nothing, sit completely still, just notice my thoughts, make no judgments, not reject or follow them.   By the end of the day I was exhausted although I’d “done” nothing.  I fell instantly asleep.  In the morning I thought, “I’ll see how it goes until breakfast”.   After breakfast I thought, “I’ll see if I can hang on ’til lunch”.  At day’s end I thought, “Maybe day three will be better“.   It was worse.  Day four was a little better, though, and so it went.  I’d suffered a lot by the end of the week but I’d also had glimpses of the truth of what Shugen Sensei told us at the start.  I was bringing my suffering onto myself.  That felt worth knowing.

Before I could go to the Himalayas I’d forced myself to retire.  It was hard because from then on, investments would have to support us.  With more time to worry, I realized my ignorance of how the economy works meant I had little confidence we’d made good investments.  So, when I wasn’t in the Himalayas I studied investment and economic theory.  The Great Recession arrived just as I was starting to feel I had the theories sufficiently clear.

Now I had to understand why our economy collapsed.  I studied governance and saw some parallels with the paralysis of government in Nepal.  That’s when I started blogging.  The US economy is embedded in the global economy.  There are so many moving parts in the system.  I had to start recording facts and analyses to get a holistic picture.  Charts and writing are my best tools for thinking and I hoped for critical feedback.

It’s only recently that I began to sense all these activities are related and they all start where Shugen Sensei was pointing.  They’re all aimed at happiness and stopping the creation of suffering.

The historical Buddha taught that we will only become truly happy when we work to end the suffering of others.  It must be so because we are not separate from others.  If they are unhappy we will also be made unhappy.  Communities were small two and a half thousand years ago.  People made each other happier or not with face to face interactions.   Today we also interact via nation-state and global systems that impact both us and future generations.  That’s why I care about governance.

The Federal Budget and GDP

I’ve come to think of charts like the ones in this post as cave paintings.  We must study them carefully to see what they reveal and also what their structural assumptions obscure.

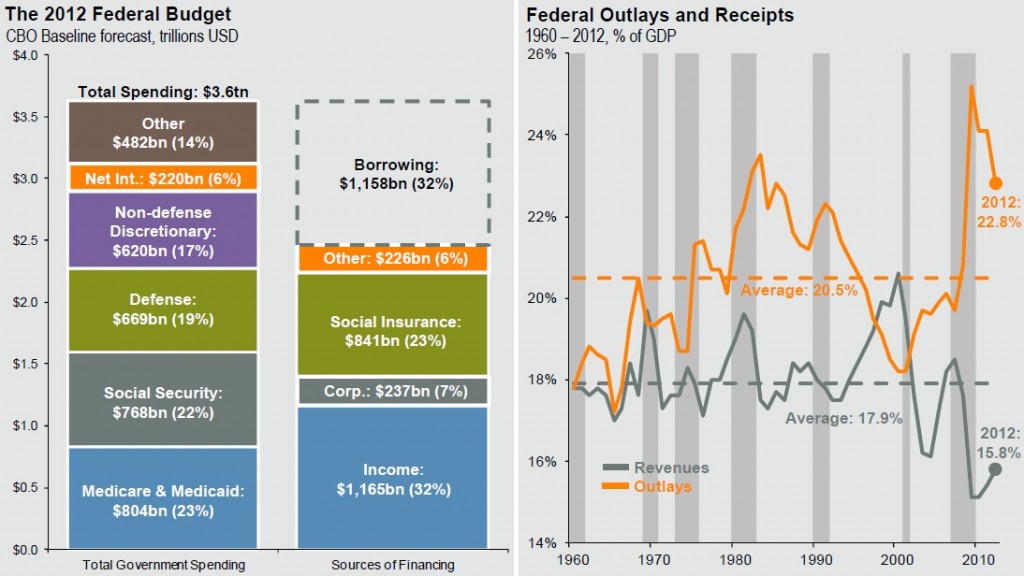
The bar chart shows we are financing  an enormous amount of Federal spending with borrowing – almost one third.  The line chart shows we spent more than revenue for most of the last half century and why the current imbalance is so enormous – the Great Recession.  As in previous recessions (indicated by darker bars), revenue fell starting in 2007/8 because incomes fell, and spending increased because unemployment increased.

federal-budget-2012

The line chart also shows revenue now heading up and spending down as in most post-recessionary times.  But here we start to wonder what we’re measuring.   It doesn’t feel like we’re out of recession.  Corporate profits are at an all-time high, the unemployment rate is a bit lower, it’s good news federal revenue and spending are heading in the right direction, but we don’t feel good.

The line chart also raises a question.  Spending fell after the early ’80s and early ’90s recessions.  Why did it increase before the most recent recession?  Largely because of a very costly unfunded new program initiated at that time, the War on Terror.

The bar chart shows only a little of what we need to understand.  A commercial enterprise with multiple lines of business (LOB) reviews each LOB’s revenue and spending individually.  This chart shows, or seems to show that for only a single Federal program, Social Security.  Since Social Insurance revenue at $841B is greater than Social Security spending at $768B, it looks to be in good shape.  But does what’s labelled “Social Insurance” revenue include Medicare as well as Social Security payroll tax?

Additional research would show that Social Security revenue is in fact greater than spending.  Digging deeper would show when that will reverse as well as the past and potential effects of adjusting the formulas that govern its revenue and spending.  As I noted in a previous post, it would, for example, show that raising the maximum wage on which S/Sec tax is withheld to its traditional real level would eliminate half the future imbalance.

The bar chart shows that the Federal Government’s borrowing costs at 6% of the total are relatively affordable at this time.  It also shows they will not be so if total spending continues to exceed revenue by such a wide margin, currently 32%.  We added $1,158B to our total debt in 2012 on which we paid $220B interest.

Questions the charts provokes but does not illuminate include:

  1. Why is Medicare/Medicaid spending so high at $804B and 23% of total spending, how much is its revenue, how can they be balanced?
  2. Why is Defense spending so high at $669B and 19% of total spending, how and by how much should it be cut?
  3. What makes up Non-Defense Discretionary Spending, are we over- or under-spending there?
  4. What makes up “Other” spending, are we over- or under-spending on elements of that?
  5. How can we best increase revenue to pay for spending we choose not to eliminate?
  6. Can we fix the federal spending/revenue imbalance with economic growth?

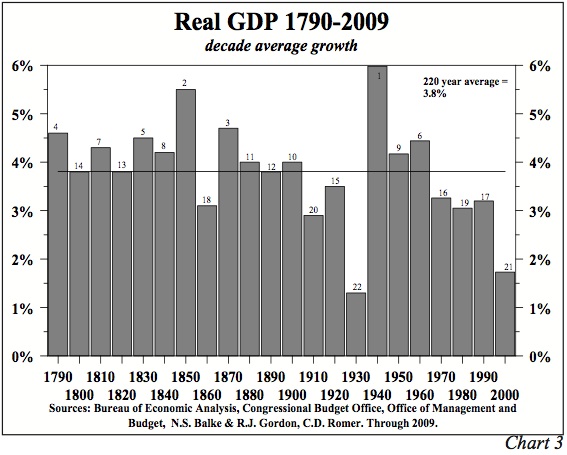
The next chart suggests the possibility of a positive answer to question 6.  Since our real economic growth in the most recent decade was at by far its lowest rate since the decade of the Great Depression, after which it grew rapidly, we could hope that experience will be repeated.

GDP Growth by Decade 1790 - 2009

The primary drivers of post-Great Depression GDP growth were spending on WW2 and on post-WW2 recovery programs including the GI Bill and mortgage subsidies.  Fortunately, WW3 seems unlikely in the near future so we need other ways to increase economic activity.  We must also answer at least the first two questions above, healthcare and defense costs.  The data is visible in cave paintings down those mine-shafts so we’ll take a flashlight and calculator as well as a canary to investigate.

The Canary and the Colly Bird

Colly birds are unexpectedly thought-provoking.  Learning that colly comes from the Old English col led me to the history of coal and other energy sources, how power shifts when it’s abused or new technology arrives, and differences between resource-extracting and self-sustaining economies.

Colliery work was very dangerous.  Workers who were not killed by mine shaft collapse, flooding, or explosive gas accidents died later from black-lung disease.  Mine owners in 19th century British held all the power and invested little in safety.   The workers could get no other jobs but they organized as the 20th century approached.  They balanced the owners’ power by striking and they got safer conditions.  In 1947 all mines were bought by the government.  The miners’ and other unions continued to gain power and make more demands via work stoppages that peaked in 1979 when over 29 million working days were lost.  In 1984, the miners stopped work for a year.  That cost the economy well over $2 billion but the government refused to negotiate and broke the unions’ power.  Stoppages were below 2 million working days by 1990.   The number of mine workers fell even more precipitously from over 700,000 in the 1940s to around 12,000 in 2002.

So, excessive power was abused first by the mine owners, then  the workers’ unions, then government gained the upper hand before re-privatizing the mines.  Union leaders got power when the workers were roused to desperate protest, then lost it when coal began to grow scarce and new technology eliminated the miners’ jobs.

UK Coal Production

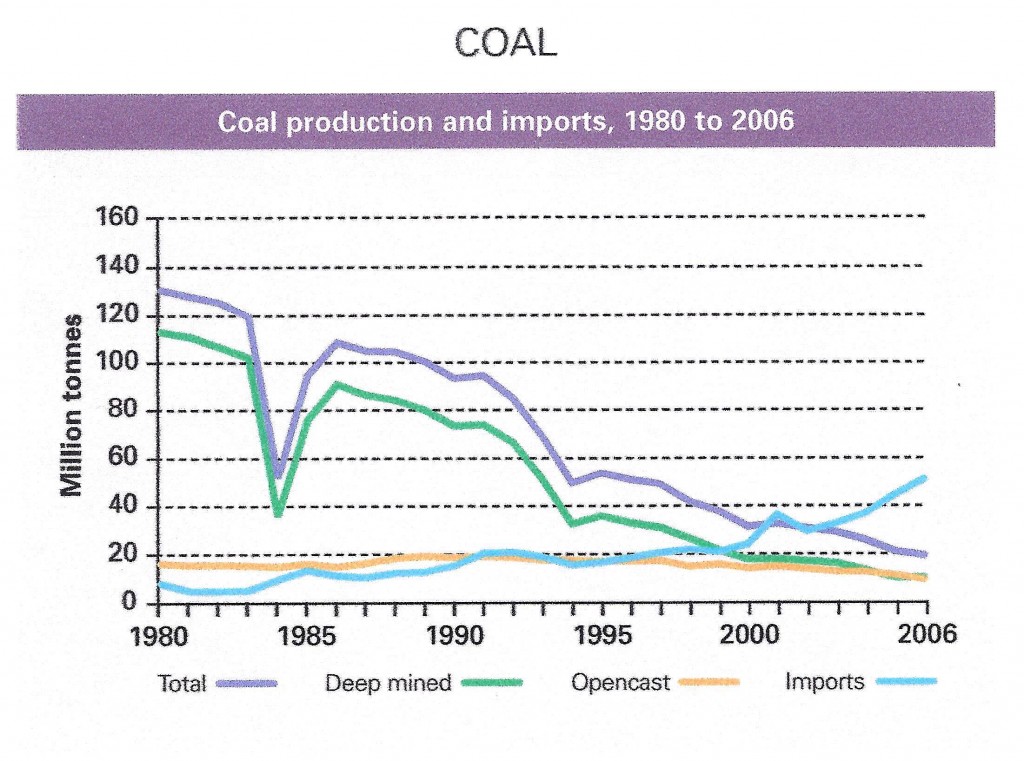
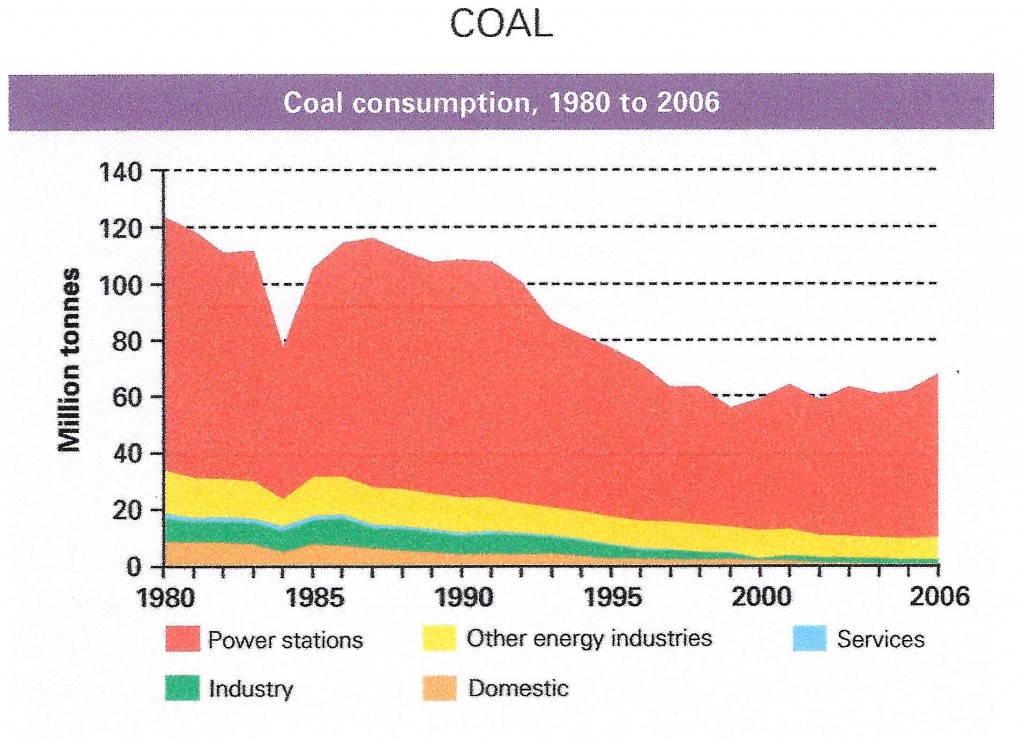
While UK coal production fell from 112 million tonnes in 1980 to 9 in 2006, coal consumption fell only from 123 million tonnes to a low of 59 million in 2000 after which it grew to 67 million in 2006.  The growth in demand for coal came from power stations that accounted for 86% of all UK coal consumption by 2006.  The drop in UK coal production was balanced by increased imports.

UK Coal Consumption

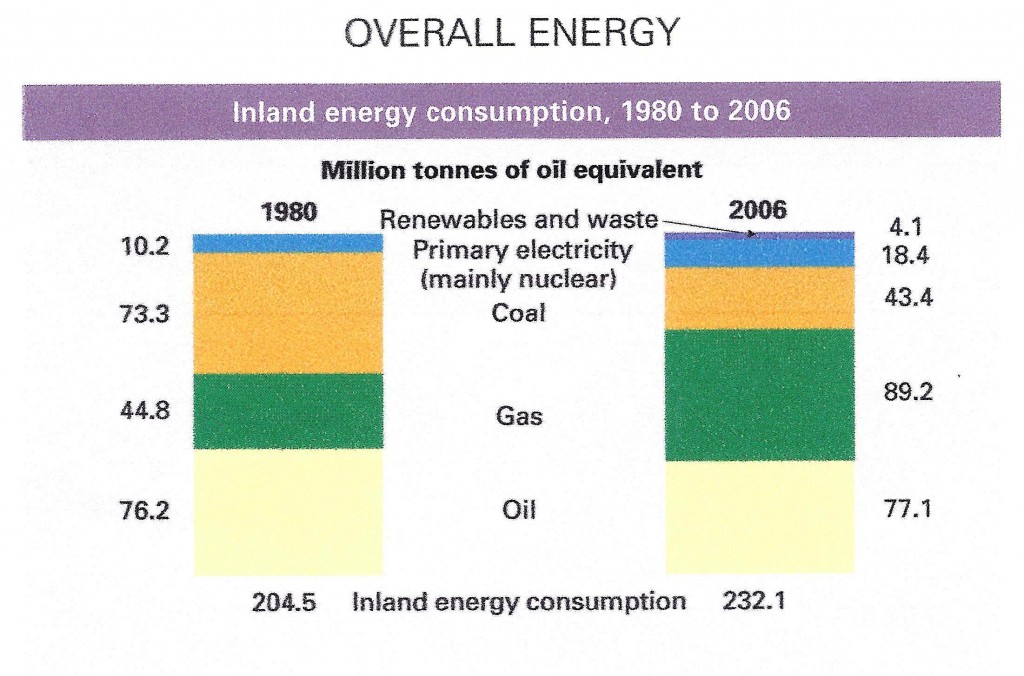
Overall UK energy use grew from 205 to 232 million tonnes of oil equivalent since 1980.  Oil use was roughly constant, coal dropped and use of natural gas doubled.

UK Energy Use

In the USA, where I found longer term data, there is much higher dependence on oil, coal still is as important as natural gas and, as in the UK, although production from renewable sources is increasing, it is still only a small fraction of the total.  I’ll return in a future post to energy use and its implications for economies and societies but first, why did I mention the canary?

US_historical_energy_consumption

Canaries were used in British coal mines from 1911 to 1987 as an early warning system.  Carbon monoxide, methane and other toxic gases in the mine shaft would kill a canary before affecting the miners.  Its signs of distress alerted the miners to escape.  It occurred to me that our house was heated by coal when I was a kid and I liked that but I knew nothing about conditions in the mines.  Could there be  mine-shafts in our economy now where great wealth is being extracted and toxicity is building up?  I felt I should take a canary to investigate.

And why colly birds again?  Because they and other birds in the song were rich folks’ food.  The audience for and singers of the song were being promised those things.  We tend to overlook toxic by-products of rich folks’ things because we like to imagine that we, too, could be rich.  That makes us vulnerable to contemporary equivalents of the Monty Python pet store salesman who insisted the deceased Norwegian Blue parrot he sold was not dead but resting, pining for the fjords or momentarily stunned, or the 4th century Greek man complaining to a slave-merchant that his new slave died who was told: “When he was with me, he never did any such thing!”  Those jokes work because we really are vulnerable to such nonsense.

We should always, but rarely do, consider incentives.  To understand a business’ sales results, understand its sales folks’ comp plan.  To understand a society, understand the basis of its economy.  Resource-extracting endeavors like coal mining encourage owners to make their one-time harvest as fast and profitably as possible.  Self-sustaining enterprises like Nepali hill farms that require terraces to be maintained for food this year also enable them to raise crops next year, and their descendants in future years.  The different bases of the two economies drive short-term-only or short-and-long-term-optimizing behaviors.

Coal mining and subsistence farming are illustrations.  I’m no romantic about village life.  My sheep needed care every day; care in bad weather, intensive care in lambing season, care when I was sick, care that must be expert or they would die.  It’s hard and stressful work that never ends and sheep die in disasters no matter what.  There are much easier ways to support oneself.  All I’m saying is we should notice negative side-effects of the way we live and consider if there are better ways.

So, in future posts I will take a canary down some jointly-owned, private-public mine-shafts that are disproportionately rewarding for their owners and harmful to others.  Four that seem especially problematic are the:

  • Miilitary-industrial mine-shaft that keeps us in a ruinously costly perpetual state of war
  • Washington-Big Oil mine-shaft that keeps us in a military trap in the Middle East and keeps climate change off our agenda
  • Washington-healthcare industry mineshaft, our largest at 17% of GDP, which costs us twice as much as in any other rich country and makes us the only one without universal healthcare
  • Washington-Wall Street one that supplies almost every US Treasury secretary and paved the way for financial crisis, mega-bailouts and not a single prosecution of criminals.

I will also explore the economic and social impact of technology.   The UK coal miners who improved their lives by increasing their relative power later lost their livelihood to new machines.  New technologies like that can greatly increase capital returns by replacing human labor, which increases unemployment and pushes down wages.  That cuts society’s ability to pay for the newly automated products and services, and everything else.

I will try to shed light on how governments can respond to:

  • A great imbalance of power in part of the economy
  • New technologies that will have disruptive economic and social impact.

Trends that Cannot Continue

Pragmatic conservative Herbert Stein gave us the Law: “If something cannot go on forever, it will stop”.  What that implies is, actions will be taken.  It also implies they are unlikely to be immediate.

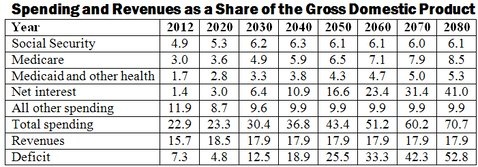
On Dec. 3, shortly before the “Fiscal Cliff”, the Government Accountability Office (GAO)  released new estimates of the federal government’s long-term budget outlook.   These numbers will not be changed much by the deal Congress so embarrassingly arrived at just after we went off the cliff.  We are still following trends that cannot continue.

Examining them in the order they appear in the table below; first Social Security (S/Sec).  Spending will grow by almost a quarter as a % of GDP as baby boomers retire and average life expectancy continues to increase, then stabilize at that level.  S/Sec revenue is at this time higher than spending but that will not continue if no action is taken.  S/Sec tax used to be levied on 90% of covered earnings.  That has fallen to 84% because most wage gains in recent years went to those making more than the maximum taxable income.  Raising the maximum so the share of covered earnings goes back to 90% would eliminate almost half of S’Sec’s projected long-term deficit.  Other small changes would fix the rest of the potential problem.

Spending & Revenue vs GDP

“Medicare, Medicaid and other health” spending now totals 4.7% of GDP, almost the same as S/Sec.  But at 8.2% it has almost doubled by 2030 then it continues to climb steadily to just under three times today’s level six decades out.   That’s the good news.  The bad news is our total healthcare spending is 17% of GDP.   “Medicare, Medicaid and other health” spending is barely a quarter of the total.  Medicare spending will grow as a higher % of our population reaches 65, and Medicaid will grow unless wages increase at the low end and unemployment drops, but those increases are relatively small in the context of our overall healthcare system.

We spend twice as much per capita on healthcare as the next highest nation, 48 million Americans have no health insurance, and other first world nations get better healthcare results.  If the 8.2% of GDP we’re projected to spend on “Medicare, Medicaid and other” in 2030 was our total healthcare spend, we’d be in great shape but it’s nowhere close.  Although the rate of increase for “Medicare etc” does not need to be cut drastically and it must be done, our healthcare system is far from easy to change.

Bypassing net interest for a moment, we find “All other spending” falls.  It will be worthwhile to examine some line items inside this category in another post.  Is it, for example, a good plan to keep cutting spending on education?  Is it a good plan to continue making war in Afghanistan?  Those questions and more are for another day.

By far the greatest problem revealed by the GAO analysis is how our growing annual deficit drives an insane rate of growth in interest costs.  The deficit grows because while spending increases steadily at rates that are too high but not alarmingly so, revenue stays at its historical average around 18% of GDP.   That drives ever increasing  cumulative debt, the interest on which more than doubles from 1.4% of GDP this year to 3% in 2020 and is almost five times as high only a decade later.  Even those numbers are only if the federal government continues to be able to borrow at 1.3% through 2017 and 3.7% in the long run, which is not possible.

Stein’s Law tells us that because the deficit cannot continue to grow as it does in the GAO’s projection, it will not.  The reason it reaches the impossible height in this projection is because relatively small growth in big spending programs like S/Sec and Medicare compounds into big numbers.  In the same way, relatively small changes in the growth rate of those programs would result in big long term changes in the deficit.

And therein lies the problem.  The Congress that raises taxes and cuts benefits will suffer politically.  Future Congresses will be the ones to get the benefits of lower deficits.  If today’s Congress does not take action, future Congresses will be forced to respond to their society’s pain from high inflation and/or high interest rates.   But we in today’s society are not feeling those pains, so there’s no motivation to act now.  What we are suffering from is low growth but there’s no quick fix for that and many ways we might attack the deficit would likely cut growth more.

Congressional inactivity is something that cannot go on forever but it looks unlikely to stop soon.  They blundered over the fiscal cliff.  I expect them to blunder through at least the next debt ceiling.  Deficit reduction is not likely in the near term.

Note:  The GAO document is at http://www.gao.gov/assets/660/650466.pdf

“Four Colly Birds,

three French hens, two turtledoves and a partridge in a pear tree.”  This old Christmas song was written when the blackbird was food along with the hen, turtledove and partridge.  Colly in Old English means ‘black’ hence ‘colliery’ meaning coal mine and colly bird meaning blackbird.  Blackbirds were gourmet food in those days.  In “Sing a Song of Sixpence” 24 of them are baked in a pie.  So here, as thought-provoking fare, are four colly charts.

Fed Tax and Spending vs GDP

The first one shows Federal spending, the red line, and revenue (taxes), the blue one, in relation to GDP, the overall economy.  Spending is now 24% of GDP, higher than its ~22% average for the past few decades while revenue is substantially lower than spending at 17% of GDP and lower than its ~19% average over the past few decades.  This chart illustrates two of our three big problems, too high spending and too low taxes.  Our third problem (which I haven’t illustrated because I want only four charts) is economic growth that’s too slow to grow us out of the revenue and spending problems.   Slamming on the brakes to fix the deficit would make all three problems worse.

Health Care Indices

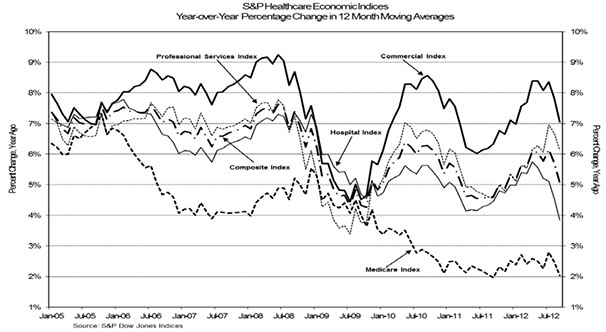
Where to cut spending?  Medicare?  We keep hearing that’s out of control.  The second chart suggests otherwise while also showing that our overall healthcare spending is unsustainable .  Medicare spending is now growing at an annual rate of 2%, right around the upper end of forecast GDP growth.  It was more than 7% six years ago.  Overall healthcare spending, however, (the composite index), which was also increasing 7% then is still growing 6% to 7%, an unaffordable burden on our economy.  Cutting Medicare, the only part of our healthcare system that is growing at an affordable rate, would increase that burden.

Labor vs Capital Share of Nonfarm Business

Where to raise revenue?  Wage-earners?  The third chart shows that after holding fairly steady at around 65% for the half century following WW2, labor’s share of non-farm business spending has, for more than a decade, been dropping fast.  It’s now around 57%.  What is correspondingly growing is capital spending.  Workers of all kinds are being replaced by computers and robots, not just by lower paid workers in other countries.  They, too, are being replaced by technology.  Capital investment is especially favorable now because interest rates have been driven so low.

Debt v Income Tp and Bottom Quintile

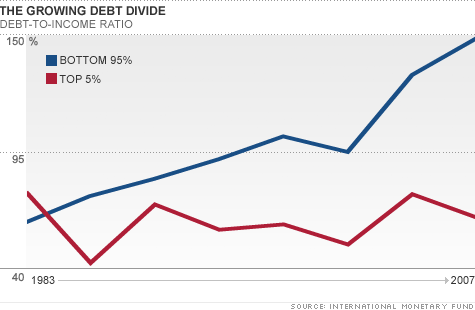
The fourth chart shows that even though low interest rates are attractive to all spenders (especially governments), they are not helping everyone equally.  Debt (also interest payments, therefore) as a percentage of income is growing rapidly for those with incomes in the bottom 5%.  That’s because their living expenses keep growing but their incomes do not.  That will not change for the better in a very slowly growing economy.

Conclusions: (1)  Here, too, there is no silver bullet.  (2) We’ll shoot ourselves in the foot (at best) if we act as if there is one.

A Tale of Two Constitutions

Nepal’s political morass has not changed in the months I was gone.  Progress is stymied by too many squabbling children in politician bodies crying “mine, mine, mine”.  How did it get this way?  Does history of the US Constitution offer guidance?

A transitory coalition of the other 5 leading parties recently announced they would no longer attend public meetings where Maoist Prime Minister Baburam Bhatterai or anyone else in his unappointed government is present.  The parties are united in wanting his government to fall, at odds on what should happen next.  The government is unappointed in the sense that there was no provision for what would happen if the Constituent Assembly (CA)  failed to draft the new Constitution.

When the CA was dissolved in May four years after its two year term began, Prime Minister Baburam said (a) we need an election to establish a body that will do what the CA failed to do, (b) we need a government in the interim, and (c) the existing government should stay in place to hold elections asap.  The second largest party, the Nepali Congress (NC), said that’s OK but Baburam must resign in favor of an NC leader.  Baburam said that’s no good because the President, who had the authority to disband the CA, is a member of the NC.  There would be too much risk the NC would hang on to power until they thought they could win an election.  If we want to make a change, he said, we should choose a coalition government for the interim.

It’s not clear how a coalition government would differ from what’s already in place nor how the politicians could ever agree who would make up the Cabinet.  The NC can’t even agree which of them would replace Baburam in the impossible event anyone else agreed to that.  Meanwhile the smaller parties make transitory alliances to promote specific agenda items that cannot be implemented in the current situation, anyway.

The leader of a party that recently split off from the Maoists published a 90 point demand.  One third of these demands relate to India, including that Indian vehicles must be banned from Nepal, Hindi movies must not be shown and Hindi music must not be broadcast.  The leader said his party would begin enforcing the demands nationwide and immediately.  Like other such initiatives, even the ones that makes sense, that soon fizzled out.

Having failed to accomplish what they were elected to do, the politicians fear they will not be reelected.  The one thing they can agree on is it’s best to keep delaying a new election.  It’s not clear how those not in the Cabinet are getting paid but it’s never clear how money flows in this society.  Transparency International reports that Nepal is the only South Asian nation whose Corruption Perception Index has worsened in the last seven years.  To get a government-financed contract, contractors must pay 50% of the project budget to politicians and civil servants who could block it.  Only 20% to 30% of the budget is spent on the goods or services provided.  They are inevitably of poor quality.

For some, the argument over the number of States in Nepal is philosophical; broader representation (more States) vs strengthening Nepal as a nation (fewer States).  For others, it’s personal.  Tribal leaders allegedly fighting for their people but wanting access to the money trough, “Nationalists” wanting to preserve the Hindu establishment’s lock on power, the breakaway party motivated by anti-Indian prejudice and seeing high caste Nepali Hindus as “really Indian”.

How did it get this way?  A regional prince who conquered his neighbors and unified the territory paid his generals with rent they could collect from newly conquered land.  After further conquests were halted by British India and imperial China the monarchy was pushed aside by the Rana family and, under new ownership, Nepal continued to be operated as a private family tax farm.  No industry developed because Nepal has no coal, oil or useful minerals and its geography makes transport very hard.  Subsistence farming was supplemented by petty trading.  One third to half the total economic output went to the center as rent.  Many men left to be soldiers in the British Indian army. When the Ranas fell 60 years ago the monarchy was restored.  Foreign aid began to arrive but much was siphoned off by the elite.  Almost the only government Nepal had ever had that was for the people was in villages with a good head man.  No surprise that apart from tourist services there are still few alternatives to getting a position to extort bribes, getting property to rent, or working abroad.

How important is a new Constitution for Nepal?  A nation’s Constitution is much like a business strategy; every business should have one and it should not be a bad one but several good ones could be successful.  A well executed good strategy will always beat a less well executed better strategy.  So Nepal’s politicians just need to choose one of the good ones, apply it diligently, and adjust as conditions change.  To illustrate, let’s take a quick look at the US Constitution that was established with equally high hopes and, as it happens, around the time Nepal first became a nation.

The US Constitution reached its current form in three stages.  First, the structure and purpose of government was articulated: (A) three branches of central government to make, enforce, and interpret the law, (B) the roles and powers of  central and local governments, and (C) what the national government would provide the people, namely justice, civil peace, common defense, things of general welfare they could not provide themselves, and freedom.  It was adopted in 1787 by a Constitutional Convention, ratified by conventions in eleven states and  went into effect in 1789.  Next, ten amendments known as the Bill of Rights were proposed in Congress and came into effect in 1791 after approval by three-fourths of the States.  It had been too hard to agree everything at once.  In the third stage, the Constitution undergoes periodic clarification and/or amendment.  It refers, for example, to “the people” but the rights it asserts for them were understood for very many years to apply only to white men.  Rights for American Indians, African Americans, women and others were adopted much later.

The US Constitution does not specify the nation’s borders, or the borders between States.  US territory greatly expanded after the Constitution was adopted and some State boundaries changed.  The Constitution is not explicit about whether States could secede and form a new nation.  The 1860s Civil War aka War of Northern Aggression established that the southern States would not be allowed to do that.  The great ongoing debate, however, is about the third element of the Constitution, the social contract, what the central government should provide to the people and how it should do so.

How have the first three Amendments, presumably considered to be the most important, stood the test of time?

The first amendment says: “Congress shall make no law respecting an establishment of religion, or prohibiting the free exercise thereof; or abridging the freedom of speech, or of the press; or the right of the people peaceably to assemble, and to petition the Government for a redress of grievances.”  This may be the most important principal in the entire Constitution.  The devil, however, is in the details.  How much freedom, for example, should there be about speech on behalf of political candidates?  My freedom is abridged if my campaign contributions are limited but if there’s no limit, I can in effect silence you.  Estimated  contributions for the most recent US election range up to $6B.  Because US politicians now need so much money to get elected they must depend on a wealthy few to whom they must deliver correspondingly big favors.  So a side effect of the Constitutional right to freedom is, at this time, a corrupt central government.

The second amendment says: “A well regulated Militia, being necessary to the security of a free State, the right of the people to keep and bear Arms, shall not be infringed”.  The intent of that tortured phraseology, at a time when only single shot firearms existed, was to prevent the central government from tyrannizing the States and, by implication, its citizens.  There was no need then to define what kinds of Arms the people could bear.  The federal government now has nuclear arms, however, and killer drones.  Does this Amendment mean the States and “the people” also have the right to them?  Nobody I know believes that but many Americans support the right to bear assault weapons (I’ll say more about that in a future post).  Some even imagine they must have assault weapons to defend against central government attack. 

The third amendment says:  “No Soldier shall, in time of peace be quartered in any house, without the consent of the Owner, nor in time of war, but in a manner to be prescribed by law”.  Although this Amendment has long been entirely irrelevant it continues to be enshrined as part of the Constitution.

What conclusions should Nepali politicians draw from this and other nations’ Constitutions and from the above examples, (1) a profoundly important right that also has a deeply corrupting effect, (2) an important safeguard when the Constitution was established that is now ineffective against that risk and creates unanticipated new dangers, and (3) a provision that became completely irrelevant ?

First, since several structures of national government have proven to be effective, Nepal’s politicians should just choose one and start governing.  Second, they should not imagine that even the most finely crafted Constitution will guarantee what the people get from their government.  Third, some Constitutional provisions will need significant update when conditions change and not all will remain relevant, anyway.  Above all, what is important is good governance.  The time for that is now.