The Federal Budget and GDP

I’ve come to think of charts like the ones in this post as cave paintings.  We must study them carefully to see what they reveal and also what their structural assumptions obscure.

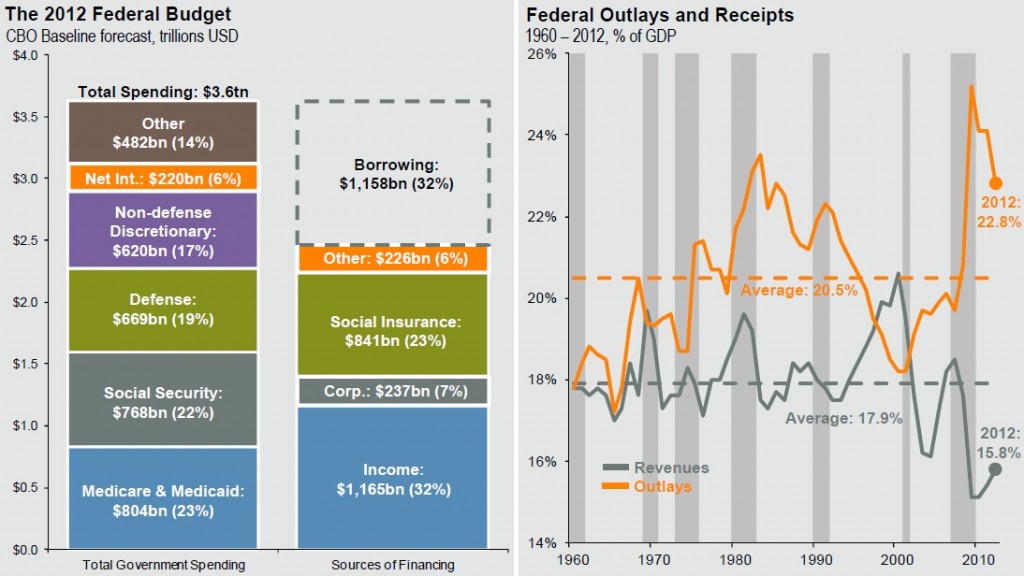
The bar chart shows we are financing  an enormous amount of Federal spending with borrowing – almost one third.  The line chart shows we spent more than revenue for most of the last half century and why the current imbalance is so enormous – the Great Recession.  As in previous recessions (indicated by darker bars), revenue fell starting in 2007/8 because incomes fell, and spending increased because unemployment increased.

federal-budget-2012

The line chart also shows revenue now heading up and spending down as in most post-recessionary times.  But here we start to wonder what we’re measuring.   It doesn’t feel like we’re out of recession.  Corporate profits are at an all-time high, the unemployment rate is a bit lower, it’s good news federal revenue and spending are heading in the right direction, but we don’t feel good.

The line chart also raises a question.  Spending fell after the early ’80s and early ’90s recessions.  Why did it increase before the most recent recession?  Largely because of a very costly unfunded new program initiated at that time, the War on Terror.

The bar chart shows only a little of what we need to understand.  A commercial enterprise with multiple lines of business (LOB) reviews each LOB’s revenue and spending individually.  This chart shows, or seems to show that for only a single Federal program, Social Security.  Since Social Insurance revenue at $841B is greater than Social Security spending at $768B, it looks to be in good shape.  But does what’s labelled “Social Insurance” revenue include Medicare as well as Social Security payroll tax?

Additional research would show that Social Security revenue is in fact greater than spending.  Digging deeper would show when that will reverse as well as the past and potential effects of adjusting the formulas that govern its revenue and spending.  As I noted in a previous post, it would, for example, show that raising the maximum wage on which S/Sec tax is withheld to its traditional real level would eliminate half the future imbalance.

The bar chart shows that the Federal Government’s borrowing costs at 6% of the total are relatively affordable at this time.  It also shows they will not be so if total spending continues to exceed revenue by such a wide margin, currently 32%.  We added $1,158B to our total debt in 2012 on which we paid $220B interest.

Questions the charts provokes but does not illuminate include:

  1. Why is Medicare/Medicaid spending so high at $804B and 23% of total spending, how much is its revenue, how can they be balanced?
  2. Why is Defense spending so high at $669B and 19% of total spending, how and by how much should it be cut?
  3. What makes up Non-Defense Discretionary Spending, are we over- or under-spending there?
  4. What makes up “Other” spending, are we over- or under-spending on elements of that?
  5. How can we best increase revenue to pay for spending we choose not to eliminate?
  6. Can we fix the federal spending/revenue imbalance with economic growth?

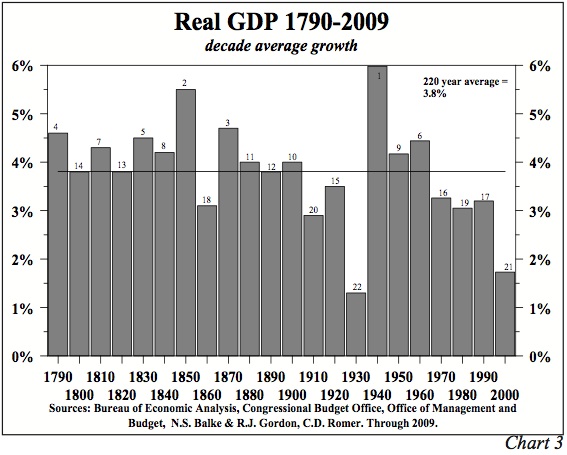
The next chart suggests the possibility of a positive answer to question 6.  Since our real economic growth in the most recent decade was at by far its lowest rate since the decade of the Great Depression, after which it grew rapidly, we could hope that experience will be repeated.

GDP Growth by Decade 1790 - 2009

The primary drivers of post-Great Depression GDP growth were spending on WW2 and on post-WW2 recovery programs including the GI Bill and mortgage subsidies.  Fortunately, WW3 seems unlikely in the near future so we need other ways to increase economic activity.  We must also answer at least the first two questions above, healthcare and defense costs.  The data is visible in cave paintings down those mine-shafts so we’ll take a flashlight and calculator as well as a canary to investigate.

Why Nepal?

A happy-making and thought-provoking side-effect of this blog is it’s re-establishing friendships from long ago.  One such friend recently wrote: “I’ve been reading your blogs trying to understand your fascination with Nepal”.  I’ve tried many times to understand that, too.

First it was the mountains.  But why was I susceptible to their allure?  My mom once worked as nanny for an Italian noble family and vacationed in Switzerland.  By the time I knew her, her life was utterly different.  She never spoke about the past and kept almost nothing.  One thing she did keep was a Swiss mountain scene that she put on my bedroom wall.  Maybe it fascinated me because it was so mysteriously different.  I never asked about it but it had a lasting impact.  I still have that picture.

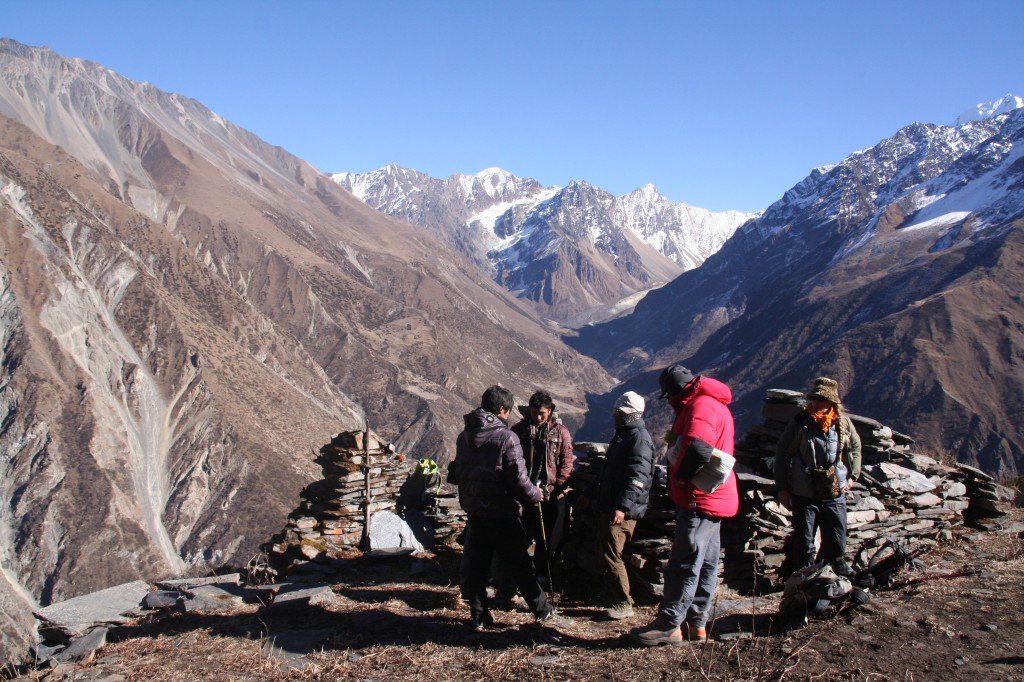
Fall 2010 867

So, when an opportunity presented itself, I went to the mountains in Nepal.  They were even more beautiful than I’d imagined.  The light is strong and always changing, so the mountains’ appearance is different from moment to moment.  The effort required to climb and descend triggers bliss-producing endorphins.  And it’s peaceful in a way we rarely experience, no TV, radio, cellphones, internet or chatter, just the undistracted opportunity to notice.   One thing I noticed was how differently the mountain people behaved.  I saw no aggression.  They were respectful both of place and people, often playful, and seemed happy though they had barely enough to survive.  And like the mountains, the people, too, tended to be beautiful.

Fall 2010 818

Back home in the USA I studied the history of Nepal, trying to understand what shaped its culture, and found it has many different cultures.  It’s similar in the mountains to the culture of neighboring Tibet.  In the southern lowlands where there is no geographical boundary with neighboring India, the culture is Indian.  In the middle hills and Kathmandu Valley are diverse blends of the two.  Why are those cultures different?  I studied the history of India and Tibet, which led me to the history of Tibet’s neighbor, China, and I began to see the underlying force of geography on history and therefore culture.

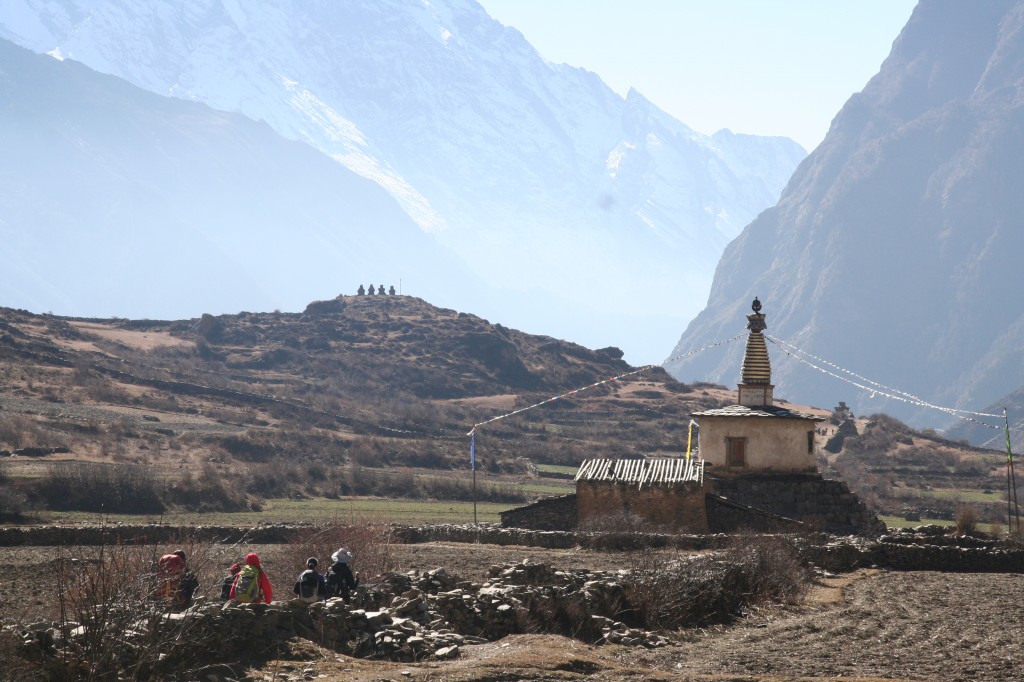
Back in Nepal again, and its neighbors Tibet, Sikkim and Bhutan, I began to realize these people who fascinated me were not so very different from me.  Can you tell the difference?

Fall 2010 955

And that led me to Buddhism.  The great majority of people in Nepal’s mountains are animist, respectful of place because there must be spirits everywhere.  How else to account for what happens?  Those with questioning minds and some education retain that foundational belief while practicing Buddhism.  It offers an established discipline for respectful practice.  It is also, as the most intelligent, thoughtful and educated Buddhist scholars say, a logical and practical guide to happiness in a universe we don’t control.  It’s much more apparent up in the mountains that while we can learn to control our mind, we cannot control the universe in which we exist.

Fall 2010 972

I never imagined we could control the universe.  I did hope to learn how to increase happiness and kindness for me and everyone I meet.  It seems not quite so difficult to work on that learning among beautiful mountains and beautiful people even though, or maybe even in part because, they are so much at risk of natural disaster and so bedeviled by centuries of corrupt administration and selfish government.

The Canary and the Colly Bird

Colly birds are unexpectedly thought-provoking.  Learning that colly comes from the Old English col led me to the history of coal and other energy sources, how power shifts when it’s abused or new technology arrives, and differences between resource-extracting and self-sustaining economies.

Colliery work was very dangerous.  Workers who were not killed by mine shaft collapse, flooding, or explosive gas accidents died later from black-lung disease.  Mine owners in 19th century British held all the power and invested little in safety.   The workers could get no other jobs but they organized as the 20th century approached.  They balanced the owners’ power by striking and they got safer conditions.  In 1947 all mines were bought by the government.  The miners’ and other unions continued to gain power and make more demands via work stoppages that peaked in 1979 when over 29 million working days were lost.  In 1984, the miners stopped work for a year.  That cost the economy well over $2 billion but the government refused to negotiate and broke the unions’ power.  Stoppages were below 2 million working days by 1990.   The number of mine workers fell even more precipitously from over 700,000 in the 1940s to around 12,000 in 2002.

So, excessive power was abused first by the mine owners, then  the workers’ unions, then government gained the upper hand before re-privatizing the mines.  Union leaders got power when the workers were roused to desperate protest, then lost it when coal began to grow scarce and new technology eliminated the miners’ jobs.

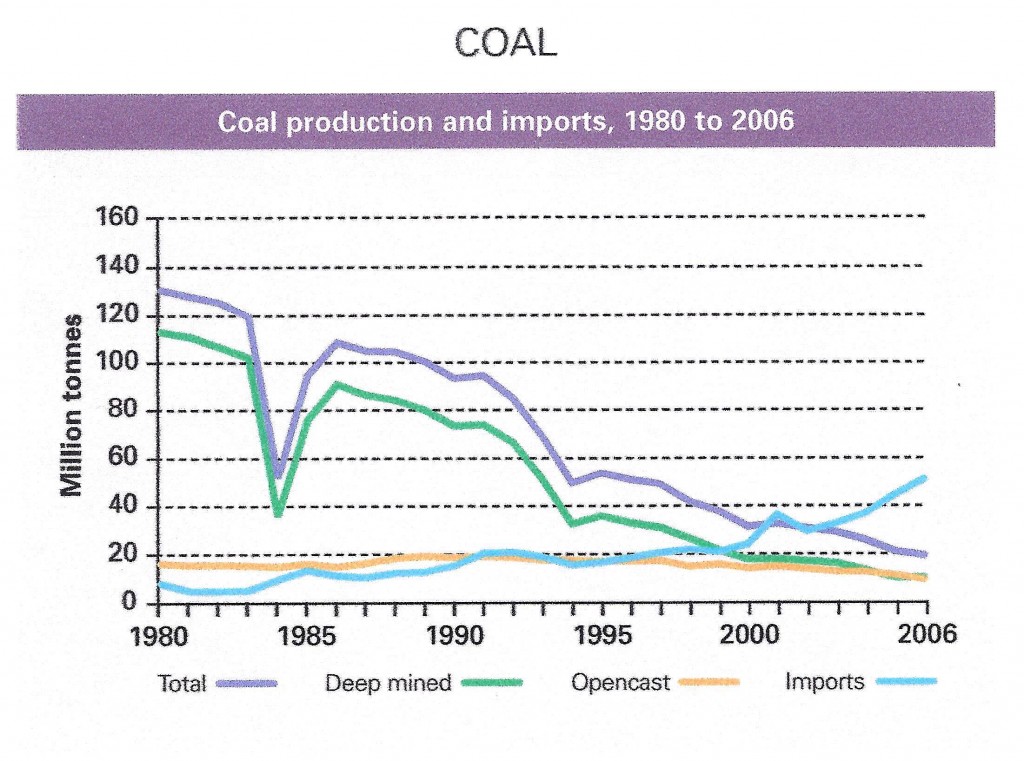
UK Coal Production

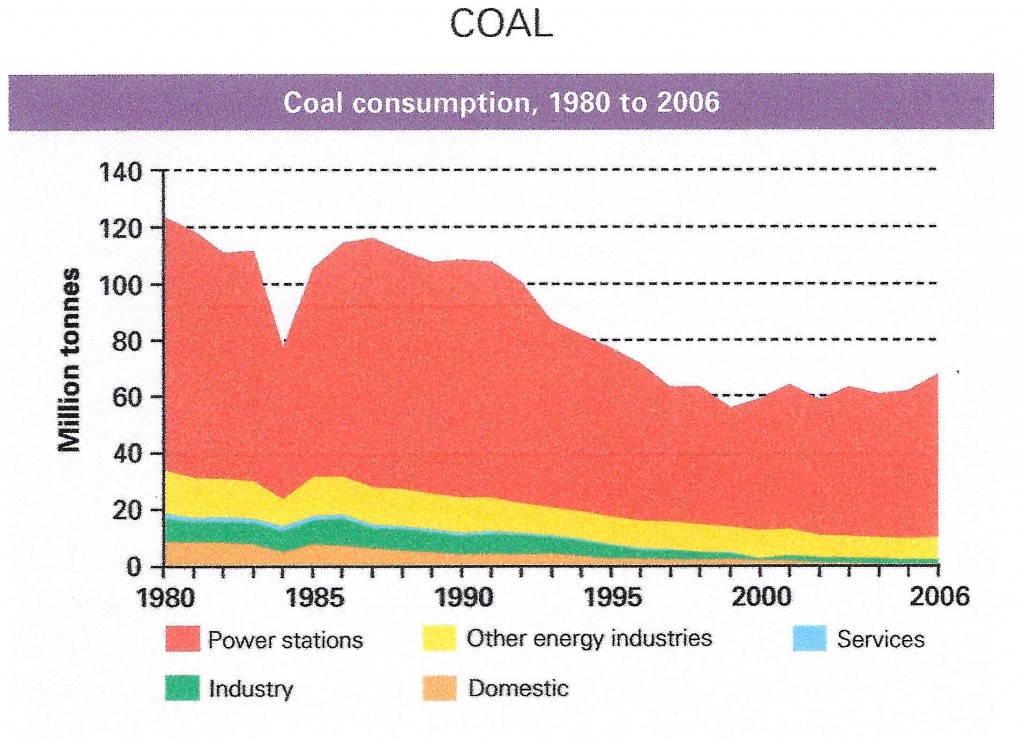
While UK coal production fell from 112 million tonnes in 1980 to 9 in 2006, coal consumption fell only from 123 million tonnes to a low of 59 million in 2000 after which it grew to 67 million in 2006.  The growth in demand for coal came from power stations that accounted for 86% of all UK coal consumption by 2006.  The drop in UK coal production was balanced by increased imports.

UK Coal Consumption

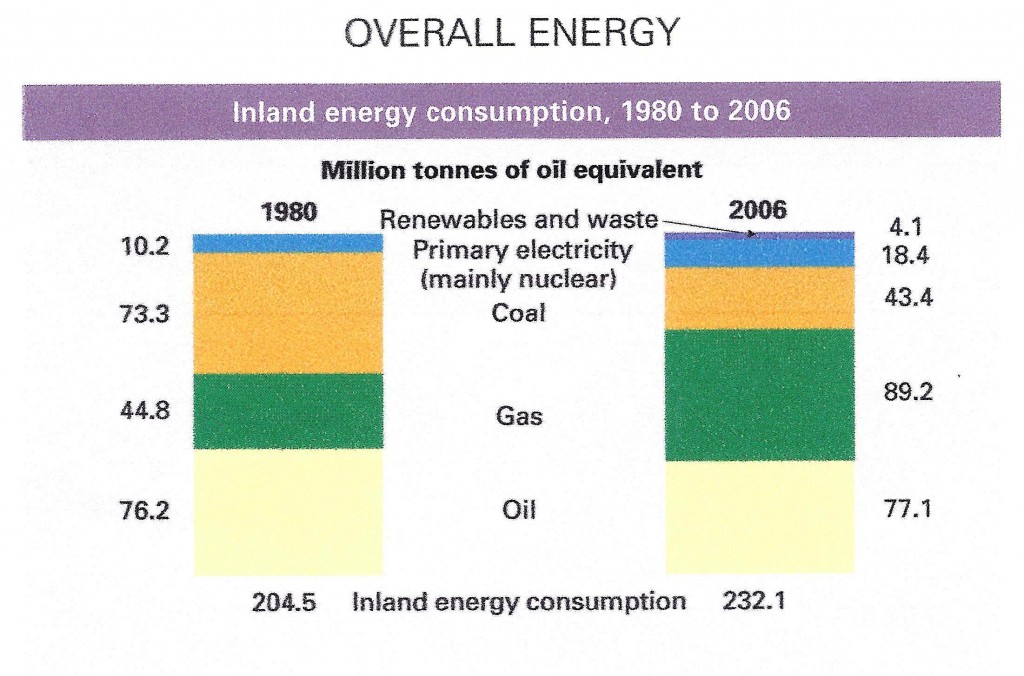
Overall UK energy use grew from 205 to 232 million tonnes of oil equivalent since 1980.  Oil use was roughly constant, coal dropped and use of natural gas doubled.

UK Energy Use

In the USA, where I found longer term data, there is much higher dependence on oil, coal still is as important as natural gas and, as in the UK, although production from renewable sources is increasing, it is still only a small fraction of the total.  I’ll return in a future post to energy use and its implications for economies and societies but first, why did I mention the canary?

US_historical_energy_consumption

Canaries were used in British coal mines from 1911 to 1987 as an early warning system.  Carbon monoxide, methane and other toxic gases in the mine shaft would kill a canary before affecting the miners.  Its signs of distress alerted the miners to escape.  It occurred to me that our house was heated by coal when I was a kid and I liked that but I knew nothing about conditions in the mines.  Could there be  mine-shafts in our economy now where great wealth is being extracted and toxicity is building up?  I felt I should take a canary to investigate.

And why colly birds again?  Because they and other birds in the song were rich folks’ food.  The audience for and singers of the song were being promised those things.  We tend to overlook toxic by-products of rich folks’ things because we like to imagine that we, too, could be rich.  That makes us vulnerable to contemporary equivalents of the Monty Python pet store salesman who insisted the deceased Norwegian Blue parrot he sold was not dead but resting, pining for the fjords or momentarily stunned, or the 4th century Greek man complaining to a slave-merchant that his new slave died who was told: “When he was with me, he never did any such thing!”  Those jokes work because we really are vulnerable to such nonsense.

We should always, but rarely do, consider incentives.  To understand a business’ sales results, understand its sales folks’ comp plan.  To understand a society, understand the basis of its economy.  Resource-extracting endeavors like coal mining encourage owners to make their one-time harvest as fast and profitably as possible.  Self-sustaining enterprises like Nepali hill farms that require terraces to be maintained for food this year also enable them to raise crops next year, and their descendants in future years.  The different bases of the two economies drive short-term-only or short-and-long-term-optimizing behaviors.

Coal mining and subsistence farming are illustrations.  I’m no romantic about village life.  My sheep needed care every day; care in bad weather, intensive care in lambing season, care when I was sick, care that must be expert or they would die.  It’s hard and stressful work that never ends and sheep die in disasters no matter what.  There are much easier ways to support oneself.  All I’m saying is we should notice negative side-effects of the way we live and consider if there are better ways.

So, in future posts I will take a canary down some jointly-owned, private-public mine-shafts that are disproportionately rewarding for their owners and harmful to others.  Four that seem especially problematic are the:

  • Miilitary-industrial mine-shaft that keeps us in a ruinously costly perpetual state of war
  • Washington-Big Oil mine-shaft that keeps us in a military trap in the Middle East and keeps climate change off our agenda
  • Washington-healthcare industry mineshaft, our largest at 17% of GDP, which costs us twice as much as in any other rich country and makes us the only one without universal healthcare
  • Washington-Wall Street one that supplies almost every US Treasury secretary and paved the way for financial crisis, mega-bailouts and not a single prosecution of criminals.

I will also explore the economic and social impact of technology.   The UK coal miners who improved their lives by increasing their relative power later lost their livelihood to new machines.  New technologies like that can greatly increase capital returns by replacing human labor, which increases unemployment and pushes down wages.  That cuts society’s ability to pay for the newly automated products and services, and everything else.

I will try to shed light on how governments can respond to:

  • A great imbalance of power in part of the economy
  • New technologies that will have disruptive economic and social impact.

Trends that Cannot Continue

Pragmatic conservative Herbert Stein gave us the Law: “If something cannot go on forever, it will stop”.  What that implies is, actions will be taken.  It also implies they are unlikely to be immediate.

On Dec. 3, shortly before the “Fiscal Cliff”, the Government Accountability Office (GAO)  released new estimates of the federal government’s long-term budget outlook.   These numbers will not be changed much by the deal Congress so embarrassingly arrived at just after we went off the cliff.  We are still following trends that cannot continue.

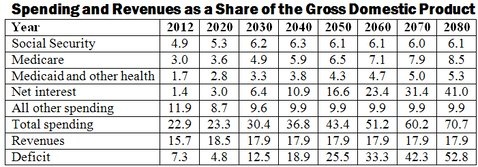
Examining them in the order they appear in the table below; first Social Security (S/Sec).  Spending will grow by almost a quarter as a % of GDP as baby boomers retire and average life expectancy continues to increase, then stabilize at that level.  S/Sec revenue is at this time higher than spending but that will not continue if no action is taken.  S/Sec tax used to be levied on 90% of covered earnings.  That has fallen to 84% because most wage gains in recent years went to those making more than the maximum taxable income.  Raising the maximum so the share of covered earnings goes back to 90% would eliminate almost half of S’Sec’s projected long-term deficit.  Other small changes would fix the rest of the potential problem.

Spending & Revenue vs GDP

“Medicare, Medicaid and other health” spending now totals 4.7% of GDP, almost the same as S/Sec.  But at 8.2% it has almost doubled by 2030 then it continues to climb steadily to just under three times today’s level six decades out.   That’s the good news.  The bad news is our total healthcare spending is 17% of GDP.   “Medicare, Medicaid and other health” spending is barely a quarter of the total.  Medicare spending will grow as a higher % of our population reaches 65, and Medicaid will grow unless wages increase at the low end and unemployment drops, but those increases are relatively small in the context of our overall healthcare system.

We spend twice as much per capita on healthcare as the next highest nation, 48 million Americans have no health insurance, and other first world nations get better healthcare results.  If the 8.2% of GDP we’re projected to spend on “Medicare, Medicaid and other” in 2030 was our total healthcare spend, we’d be in great shape but it’s nowhere close.  Although the rate of increase for “Medicare etc” does not need to be cut drastically and it must be done, our healthcare system is far from easy to change.

Bypassing net interest for a moment, we find “All other spending” falls.  It will be worthwhile to examine some line items inside this category in another post.  Is it, for example, a good plan to keep cutting spending on education?  Is it a good plan to continue making war in Afghanistan?  Those questions and more are for another day.

By far the greatest problem revealed by the GAO analysis is how our growing annual deficit drives an insane rate of growth in interest costs.  The deficit grows because while spending increases steadily at rates that are too high but not alarmingly so, revenue stays at its historical average around 18% of GDP.   That drives ever increasing  cumulative debt, the interest on which more than doubles from 1.4% of GDP this year to 3% in 2020 and is almost five times as high only a decade later.  Even those numbers are only if the federal government continues to be able to borrow at 1.3% through 2017 and 3.7% in the long run, which is not possible.

Stein’s Law tells us that because the deficit cannot continue to grow as it does in the GAO’s projection, it will not.  The reason it reaches the impossible height in this projection is because relatively small growth in big spending programs like S/Sec and Medicare compounds into big numbers.  In the same way, relatively small changes in the growth rate of those programs would result in big long term changes in the deficit.

And therein lies the problem.  The Congress that raises taxes and cuts benefits will suffer politically.  Future Congresses will be the ones to get the benefits of lower deficits.  If today’s Congress does not take action, future Congresses will be forced to respond to their society’s pain from high inflation and/or high interest rates.   But we in today’s society are not feeling those pains, so there’s no motivation to act now.  What we are suffering from is low growth but there’s no quick fix for that and many ways we might attack the deficit would likely cut growth more.

Congressional inactivity is something that cannot go on forever but it looks unlikely to stop soon.  They blundered over the fiscal cliff.  I expect them to blunder through at least the next debt ceiling.  Deficit reduction is not likely in the near term.

Note:  The GAO document is at http://www.gao.gov/assets/660/650466.pdf

“Four Colly Birds,

three French hens, two turtledoves and a partridge in a pear tree.”  This old Christmas song was written when the blackbird was food along with the hen, turtledove and partridge.  Colly in Old English means ‘black’ hence ‘colliery’ meaning coal mine and colly bird meaning blackbird.  Blackbirds were gourmet food in those days.  In “Sing a Song of Sixpence” 24 of them are baked in a pie.  So here, as thought-provoking fare, are four colly charts.

Fed Tax and Spending vs GDP

The first one shows Federal spending, the red line, and revenue (taxes), the blue one, in relation to GDP, the overall economy.  Spending is now 24% of GDP, higher than its ~22% average for the past few decades while revenue is substantially lower than spending at 17% of GDP and lower than its ~19% average over the past few decades.  This chart illustrates two of our three big problems, too high spending and too low taxes.  Our third problem (which I haven’t illustrated because I want only four charts) is economic growth that’s too slow to grow us out of the revenue and spending problems.   Slamming on the brakes to fix the deficit would make all three problems worse.

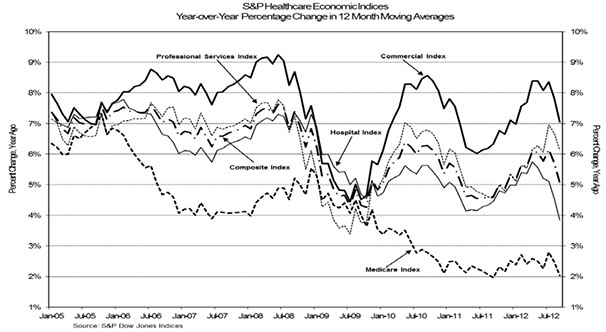
Health Care Indices

Where to cut spending?  Medicare?  We keep hearing that’s out of control.  The second chart suggests otherwise while also showing that our overall healthcare spending is unsustainable .  Medicare spending is now growing at an annual rate of 2%, right around the upper end of forecast GDP growth.  It was more than 7% six years ago.  Overall healthcare spending, however, (the composite index), which was also increasing 7% then is still growing 6% to 7%, an unaffordable burden on our economy.  Cutting Medicare, the only part of our healthcare system that is growing at an affordable rate, would increase that burden.

Labor vs Capital Share of Nonfarm Business

Where to raise revenue?  Wage-earners?  The third chart shows that after holding fairly steady at around 65% for the half century following WW2, labor’s share of non-farm business spending has, for more than a decade, been dropping fast.  It’s now around 57%.  What is correspondingly growing is capital spending.  Workers of all kinds are being replaced by computers and robots, not just by lower paid workers in other countries.  They, too, are being replaced by technology.  Capital investment is especially favorable now because interest rates have been driven so low.

Debt v Income Tp and Bottom Quintile

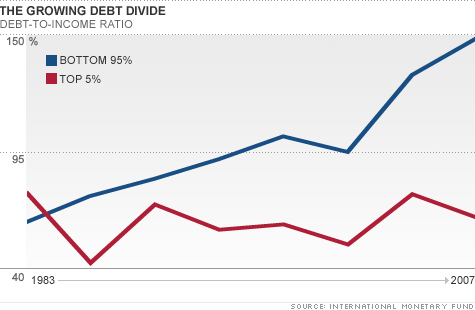
The fourth chart shows that even though low interest rates are attractive to all spenders (especially governments), they are not helping everyone equally.  Debt (also interest payments, therefore) as a percentage of income is growing rapidly for those with incomes in the bottom 5%.  That’s because their living expenses keep growing but their incomes do not.  That will not change for the better in a very slowly growing economy.

Conclusions: (1)  Here, too, there is no silver bullet.  (2) We’ll shoot ourselves in the foot (at best) if we act as if there is one.

The Massacre in My Home Town

Twenty young children were shot to death last week in Newtown CT where I lived for 35 years.  Setting aside the emotion, why do these things happen and what can we do?  The NRA says we should place armed guards in every school.  Others say we should ban guns, we need more religion, we should ban violent video games.   What do the statistics suggest?

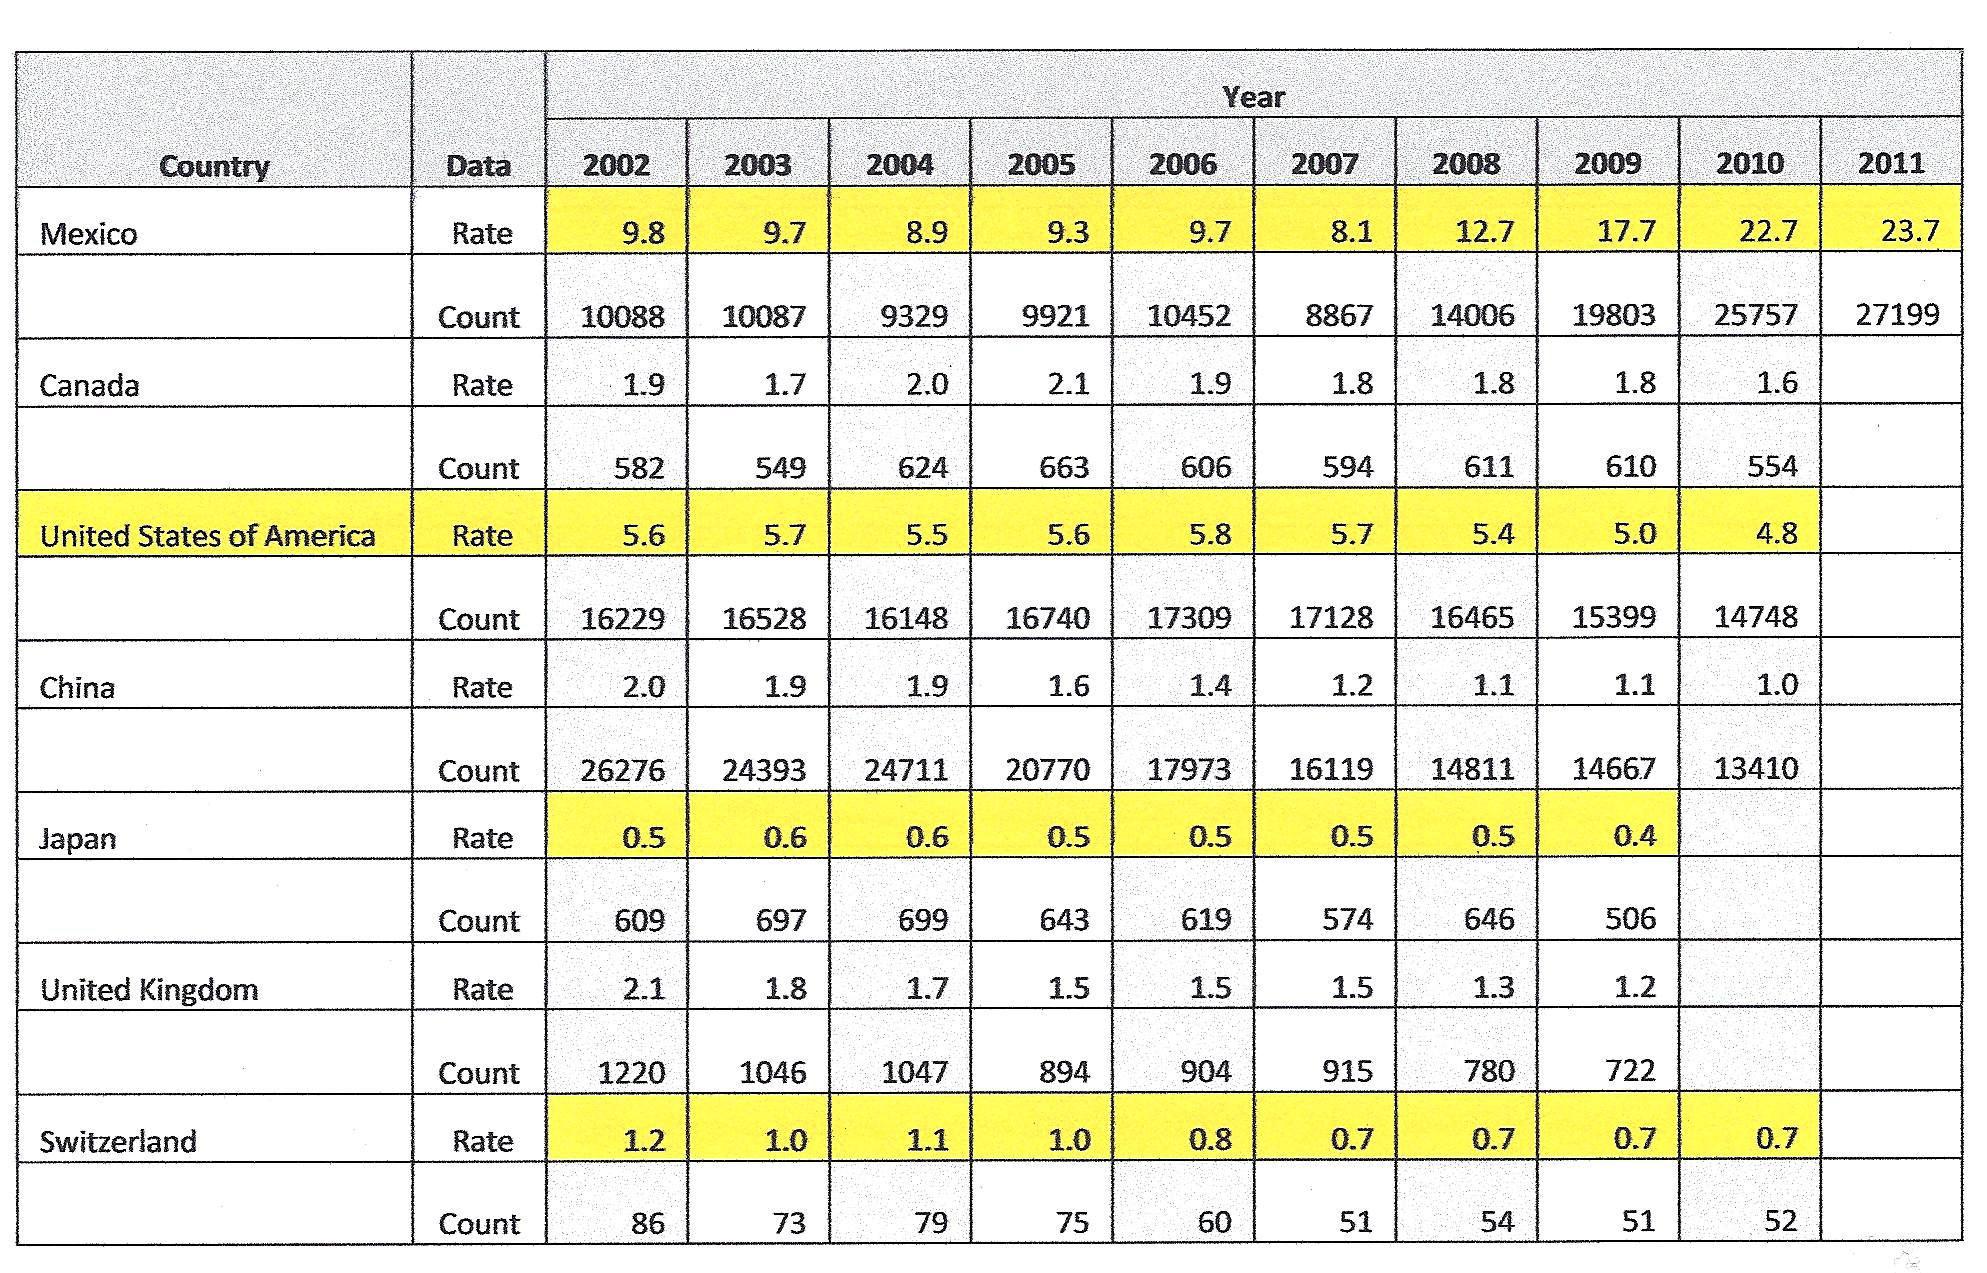
The following table of UN data shows our results in the context of  some other countries for the past decade.  We average around 5 homicides (intentional killings) per one hundred thousand people per year.   Because there are more than 300 million of us that means we have around 15,000 homicides per year.  Because Canada’s 35 million population is only about a tenth of ours and their homicide rate is one third of ours, they have only 550 homicides per year.  Our other neighbor, Mexico, has a population of 115 million.  Because their homicide rate was twice as high as ours at the start of the decade and is now over four times as high, they have over twice as many homicides as we do, 27,000 last year.

Homicide Statistics

The rate in the UK was one third as high as ours, about the same as Canada’s, at the start of the decade and is now only a quarter.  China’s rate is about the same as the UK’s and has dropped in the same way.  Switzerland has a much lower rate, around one seventh of ours.  Japan has by far the lowest.  It is stable at around one tenth of ours per capita.

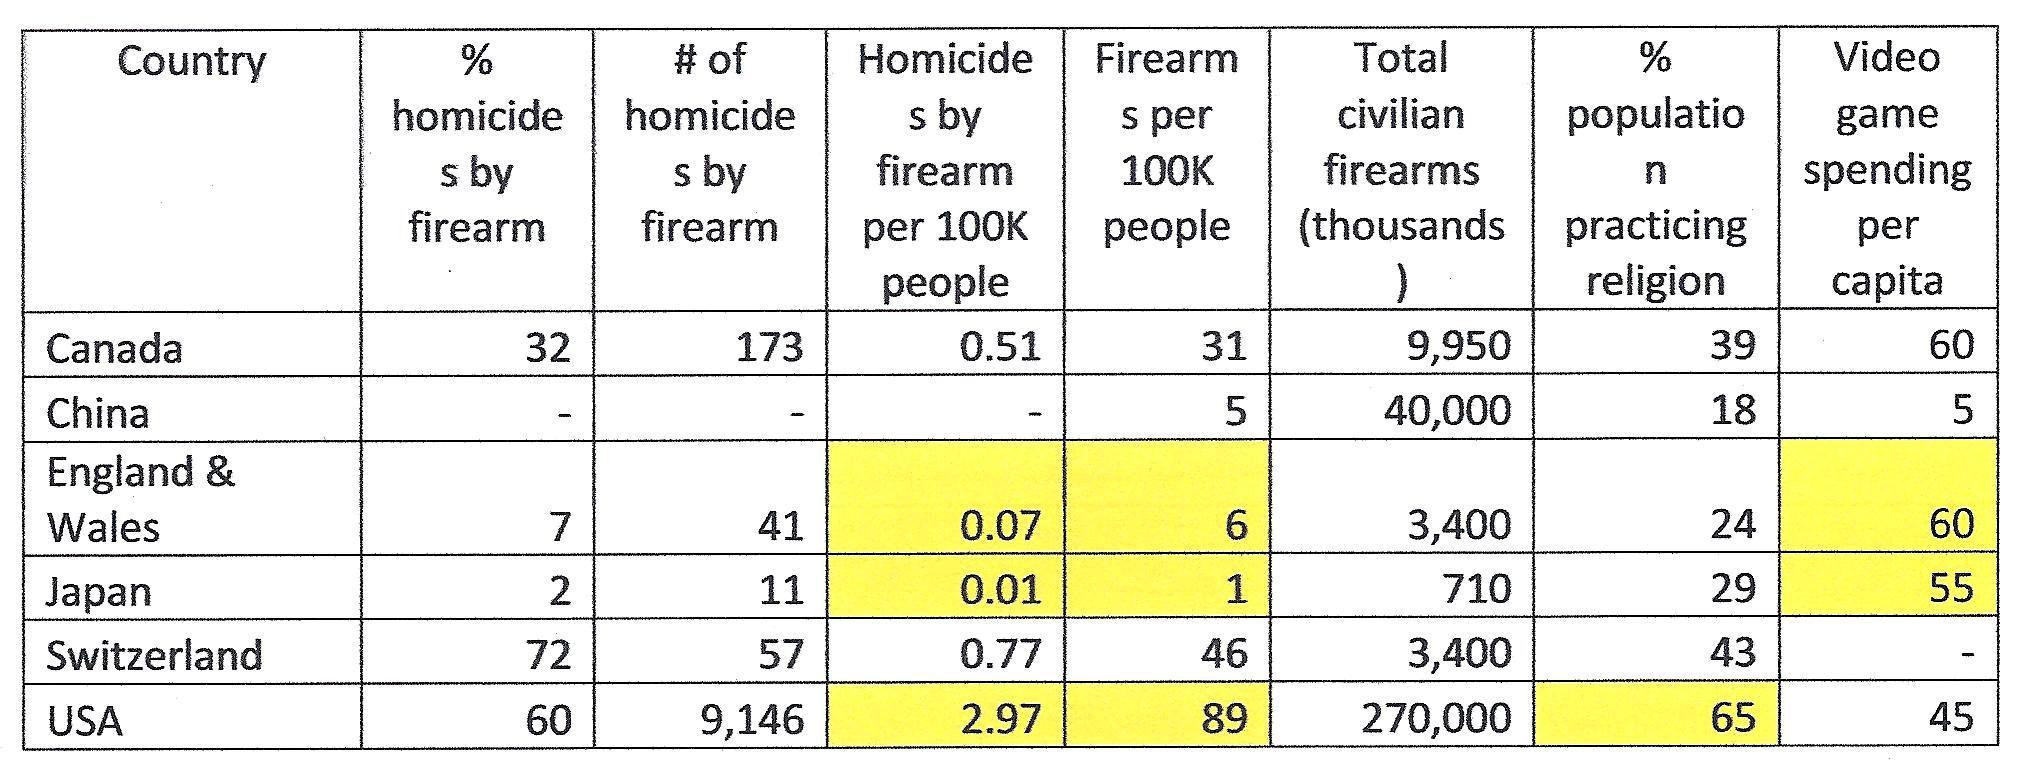
How about homicides specifically by firearms?  Are the rates of  those homicides correlated with gun ownership, religious practice or video game spending?  The following table combines statistics from several well respected sources.  The data are not all from the same year (the range is 2007 to 2011) and the number who practice religion is self-reported census data so it should be taken with a grain of salt.  Nonetheless, the data are dependable enough to support some conclusions.  One thing that stands out is our very high rate of homicides by firearm, almost 300 times as high as the rate in Japan.

Firearm Homicides

Our rate of firearm ownership is also by far the highest.  Our 270,000 thousand firearms in civilian possession means we have almost 90% as many firearms as people.  The most interesting statistic in this column is Switzerland’s 46% rate.  Switzerland has no standing army, only a peoples’ militia for its national defense, the vast majority of men between the ages of 20 and 30 undergo military training, including weapons training, and their weapons are kept at home as part of their military obligations.  Their gun ownership rate is half ours, their percentage of homicides by firearm is similar to ours, but their firearm homicide rate is one quarter of ours.  Even so, it is twice as high as Canada’s and enormously higher than the rates in the UK and Japan.

These firearm-related statistics show that a higher rate of gun ownership is correlated with a higher percentage of homicides by firearm and that tighter gun control legislation, e.g., Switzerland’s vs ours, leads to a relatively lower rate.  The first table shows that there is from country to country a much wider range of homicides by all causes.  The rate in Mexico, for example, is 40 to 50 times as high as in Japan while ours is 10 times as high.   Those big differences must result from a combination of situational and cultural factors.  Criminalization of our insatiable appetite for drugs, for example, which makes smuggling so profitable, is one cause of Mexico’s violence.

Is religious instruction a way to reduce violence?  The statistics say otherwise.  Two thirds of Americans report themselves as religious practitioners, significantly more than other countries.  Only 29% of Japanese identify themselves as followers of a religion despite their very low homicide rate.

Violent video games and movies are also blamed but again the statistics say otherwise.  The nations with the lowest firearm homicide rates, Japan and the UK, are among the highest spenders on video games.

So what does the data suggest we should do?  While the data tells us we cannot eliminate homicide, we know we can eliminate the kind of homicide in my home town last week by banning civilian possession of automatic weapons, the only weapons making that kind of massacre possible.  As noted in my previous post, the writers of the 2nd Amendment gave us the right to bear the arms of their time, single shot firearms.  They did not intend for civilians to have grenades or automatic firearms.  We don’t claim a right to bear grenades.  We should not claim a right to bear other such weaponry.

The second table shows a clear correlation between the number of firearms in civilian hands and the rate of homicides by firearms.  While Switzerland’s overall homicide rate is lower than relatively peaceful China, Canada and the UK, a high percentage of them is by firearms.  Only Japan has a significantly lower overall homicide rate than Switzerland.  This says we could significantly cut our overall homicide rate by implementing tougher gun control as Switzerland does, and cut it even more with stricter control as in Japan.  More religion or less video games are not indicated.  Better mental healthcare is indicated although I have not assembled the stats.

Statistics alone can not show us how to cut our homicide rate tenfold or even further.  They give us a first answer to “why do these things happen and what can we do?” but shed no light on the root cause of homicide.  Why, for example, do so many of us feel the need for weapons?  My Swedish classmate Peter asks us about Buddhist practitioners who, when they go alone deep into the jungle to meditate, take a weapon.  “What if I’m attacked by a robber or a bear” they think?  They hope their meditation practice will in the end remove the cause of their fears.  They expect their fear of attack while meditating will make it less effective and hope a weapon in the meantime will help them focus.  More dramatically, my American friend Sean pretends to propose a Federal program to arm every schoolchild with an automatic weapon for self-defense.  We can (I hope)  all agree that would be a crazy response to our fears.  Maybe we can reflect and find some of our own crazy ideas that make us all vulnerable to causing violence.

But we can in any case see what to do to make an immediate big difference.  We must update our approach to gun control.  With well written and well enforced legislation we could eliminate the Newtown type of massacre altogether and cut our overall homicide rate by at least half.  There is no benefit to society in not doing that.

A Tale of Two Constitutions

Nepal’s political morass has not changed in the months I was gone.  Progress is stymied by too many squabbling children in politician bodies crying “mine, mine, mine”.  How did it get this way?  Does history of the US Constitution offer guidance?

A transitory coalition of the other 5 leading parties recently announced they would no longer attend public meetings where Maoist Prime Minister Baburam Bhatterai or anyone else in his unappointed government is present.  The parties are united in wanting his government to fall, at odds on what should happen next.  The government is unappointed in the sense that there was no provision for what would happen if the Constituent Assembly (CA)  failed to draft the new Constitution.

When the CA was dissolved in May four years after its two year term began, Prime Minister Baburam said (a) we need an election to establish a body that will do what the CA failed to do, (b) we need a government in the interim, and (c) the existing government should stay in place to hold elections asap.  The second largest party, the Nepali Congress (NC), said that’s OK but Baburam must resign in favor of an NC leader.  Baburam said that’s no good because the President, who had the authority to disband the CA, is a member of the NC.  There would be too much risk the NC would hang on to power until they thought they could win an election.  If we want to make a change, he said, we should choose a coalition government for the interim.

It’s not clear how a coalition government would differ from what’s already in place nor how the politicians could ever agree who would make up the Cabinet.  The NC can’t even agree which of them would replace Baburam in the impossible event anyone else agreed to that.  Meanwhile the smaller parties make transitory alliances to promote specific agenda items that cannot be implemented in the current situation, anyway.

The leader of a party that recently split off from the Maoists published a 90 point demand.  One third of these demands relate to India, including that Indian vehicles must be banned from Nepal, Hindi movies must not be shown and Hindi music must not be broadcast.  The leader said his party would begin enforcing the demands nationwide and immediately.  Like other such initiatives, even the ones that makes sense, that soon fizzled out.

Having failed to accomplish what they were elected to do, the politicians fear they will not be reelected.  The one thing they can agree on is it’s best to keep delaying a new election.  It’s not clear how those not in the Cabinet are getting paid but it’s never clear how money flows in this society.  Transparency International reports that Nepal is the only South Asian nation whose Corruption Perception Index has worsened in the last seven years.  To get a government-financed contract, contractors must pay 50% of the project budget to politicians and civil servants who could block it.  Only 20% to 30% of the budget is spent on the goods or services provided.  They are inevitably of poor quality.

For some, the argument over the number of States in Nepal is philosophical; broader representation (more States) vs strengthening Nepal as a nation (fewer States).  For others, it’s personal.  Tribal leaders allegedly fighting for their people but wanting access to the money trough, “Nationalists” wanting to preserve the Hindu establishment’s lock on power, the breakaway party motivated by anti-Indian prejudice and seeing high caste Nepali Hindus as “really Indian”.

How did it get this way?  A regional prince who conquered his neighbors and unified the territory paid his generals with rent they could collect from newly conquered land.  After further conquests were halted by British India and imperial China the monarchy was pushed aside by the Rana family and, under new ownership, Nepal continued to be operated as a private family tax farm.  No industry developed because Nepal has no coal, oil or useful minerals and its geography makes transport very hard.  Subsistence farming was supplemented by petty trading.  One third to half the total economic output went to the center as rent.  Many men left to be soldiers in the British Indian army. When the Ranas fell 60 years ago the monarchy was restored.  Foreign aid began to arrive but much was siphoned off by the elite.  Almost the only government Nepal had ever had that was for the people was in villages with a good head man.  No surprise that apart from tourist services there are still few alternatives to getting a position to extort bribes, getting property to rent, or working abroad.

How important is a new Constitution for Nepal?  A nation’s Constitution is much like a business strategy; every business should have one and it should not be a bad one but several good ones could be successful.  A well executed good strategy will always beat a less well executed better strategy.  So Nepal’s politicians just need to choose one of the good ones, apply it diligently, and adjust as conditions change.  To illustrate, let’s take a quick look at the US Constitution that was established with equally high hopes and, as it happens, around the time Nepal first became a nation.

The US Constitution reached its current form in three stages.  First, the structure and purpose of government was articulated: (A) three branches of central government to make, enforce, and interpret the law, (B) the roles and powers of  central and local governments, and (C) what the national government would provide the people, namely justice, civil peace, common defense, things of general welfare they could not provide themselves, and freedom.  It was adopted in 1787 by a Constitutional Convention, ratified by conventions in eleven states and  went into effect in 1789.  Next, ten amendments known as the Bill of Rights were proposed in Congress and came into effect in 1791 after approval by three-fourths of the States.  It had been too hard to agree everything at once.  In the third stage, the Constitution undergoes periodic clarification and/or amendment.  It refers, for example, to “the people” but the rights it asserts for them were understood for very many years to apply only to white men.  Rights for American Indians, African Americans, women and others were adopted much later.

The US Constitution does not specify the nation’s borders, or the borders between States.  US territory greatly expanded after the Constitution was adopted and some State boundaries changed.  The Constitution is not explicit about whether States could secede and form a new nation.  The 1860s Civil War aka War of Northern Aggression established that the southern States would not be allowed to do that.  The great ongoing debate, however, is about the third element of the Constitution, the social contract, what the central government should provide to the people and how it should do so.

How have the first three Amendments, presumably considered to be the most important, stood the test of time?

The first amendment says: “Congress shall make no law respecting an establishment of religion, or prohibiting the free exercise thereof; or abridging the freedom of speech, or of the press; or the right of the people peaceably to assemble, and to petition the Government for a redress of grievances.”  This may be the most important principal in the entire Constitution.  The devil, however, is in the details.  How much freedom, for example, should there be about speech on behalf of political candidates?  My freedom is abridged if my campaign contributions are limited but if there’s no limit, I can in effect silence you.  Estimated  contributions for the most recent US election range up to $6B.  Because US politicians now need so much money to get elected they must depend on a wealthy few to whom they must deliver correspondingly big favors.  So a side effect of the Constitutional right to freedom is, at this time, a corrupt central government.

The second amendment says: “A well regulated Militia, being necessary to the security of a free State, the right of the people to keep and bear Arms, shall not be infringed”.  The intent of that tortured phraseology, at a time when only single shot firearms existed, was to prevent the central government from tyrannizing the States and, by implication, its citizens.  There was no need then to define what kinds of Arms the people could bear.  The federal government now has nuclear arms, however, and killer drones.  Does this Amendment mean the States and “the people” also have the right to them?  Nobody I know believes that but many Americans support the right to bear assault weapons (I’ll say more about that in a future post).  Some even imagine they must have assault weapons to defend against central government attack. 

The third amendment says:  “No Soldier shall, in time of peace be quartered in any house, without the consent of the Owner, nor in time of war, but in a manner to be prescribed by law”.  Although this Amendment has long been entirely irrelevant it continues to be enshrined as part of the Constitution.

What conclusions should Nepali politicians draw from this and other nations’ Constitutions and from the above examples, (1) a profoundly important right that also has a deeply corrupting effect, (2) an important safeguard when the Constitution was established that is now ineffective against that risk and creates unanticipated new dangers, and (3) a provision that became completely irrelevant ?

First, since several structures of national government have proven to be effective, Nepal’s politicians should just choose one and start governing.  Second, they should not imagine that even the most finely crafted Constitution will guarantee what the people get from their government.  Third, some Constitutional provisions will need significant update when conditions change and not all will remain relevant, anyway.  Above all, what is important is good governance.  The time for that is now.
Waiting for Godot in Kathmandu

The easy part is sleeping the first day or two after a long journey.  What takes longer is sleeping at the right time once you’ve caught up on sleep.  That teaches patience.  So I enjoy my masala omelet for breakfast, veg momos for lunch, chicken fried rice for dinner, I circumambulate Boudha stupa, do laundry, take showers when the water is warm, email when there’s power, and read Steven Pinker’s “How the Mind Works” while waiting for my own to become functional again.

Nepal’s political situation hasn’t changed.  The politicians are still arguing about anything and everything.  They almost agreed there should be an election for a new Constituent Assembly (CA) to draft a Constitution.  They almost agreed that before.  There was going to be an election in November.  Now they’re saying, if they agree, that is, there could be an election next May.  There has to be an amendment to the existing interim constitution to authorize the election because the first CA was supposed to draft the new constitution and there was no expectation they might fail to do that.  The politicians can’t agree what form the modification to the interim constitution should take.  They also can’t agree who should lead the government during the interim.

The issue cited as the roadblock to agreement about the new constitution, the one the CA was supposed to draft, is the number of districts (pradeshes) in Nepal’s new secular, democratic federal republic.  The UCPN-M (Maoist party) says there must be 10 or 14 pradeshes with no more than 2 in the Tarai (the area in the south adjoining India).  The UDMF (Madhesi confederation of Tarai folks) currently agrees about that.  The NC (Nepali Congress, Nepal’s first political party) says there must be 6 pradeshes, or 11.  The UML (United Marxist-Leninist party) says there must be exactly 7.  There are many fringe parties with only a few members in the disbanded CA but nobody cares what they think.  The four major parties do agree that demarcation and naming of the pradeshes can wait until after the election.

This got me thinking about the French Revolution.  They were against the provincial structure that existed under the monarchy.  They favored the rights of the individual and a strong nation.  They considered the state architecture based on parochial cultural traditions and local privileges to be reactionary.  They were for a uni-lingual state.  The underlying issue in Nepal is indigenous rights vs unification.  The Maoists got much of their support by promising the tribal folks they could self-administer, follow their own cultural traditions, and use their own languages.  But Nepali speaking Hindus don’t want to lose the privileged position they had under the former Hindu monarchy.  Also, there’s philosophical disagreement about the best national architecture for Nepal.

What could be learned from existing models?  France is centralized, unilingual and has a president who behaves in many ways as monarchs did.  India is a multilingual, multiethnic secular federation.  The US is a federation of states whose number and boundaries evolved over time.  Maine split off from Massachusetts, for example.  US States have substantial rights, everything not explicitly granted to the center.  How much scope should be provided for evolution?  The US is secular per the constitution but added “under God” when feeling threatened by communism, was primarily unilingual but is becoming bilingual, briefly split into two nations, and so on.

Nepal’s politicians have no experience forming agreements to take action.  How will that develop?  They are ignorant of how to govern because there have been no Nepali leaders to show the way.

So why am I thinking about Samuel Beckett’s Waiting for Godot?   In that absurdist play, two men wait vainly for someone named Godot to arrive.  They claim he’s an acquaintance but admit they would not recognize him.  To occupy the time they eat, sleep, converse, argue, sing, play games, exercise, swap hats, and contemplate suicide.  It’s a sadly apt metaphor for today’s Nepal.

Not for me.  For one thing, there’s nobody here with whom I could swap hats.  For another, I’m not here to wait.  I’m here to practice not waiting for some fantasy about the future.  I’m here to practice not replaying stories about the past.  I’m here to practice being 100% aware right now in this moment.  If I get another moment, I’ll try to be 100% aware then, too.  That way, I’ll know what to do in each moment.  It’s like the better I’d practice playing tennis like Roger Federer, the fewer shots I’d miss.  The better I practice being awake, the fewer moments I’ll waste.

Social Security – Past and Future Changes

Social Security was originally established as insurance.  The Old-Age, Survivors, and Disability Insurance Act (OASDI) was for those who became unable to support themselves.  At that time, during the Great Depression, the poverty rate among senior citizens was over 50%.  OASDI became a pension plan a half century later when in 1983, President Reagan sponsored an increase in Social Security taxes, changing the program from pay-as-you-go to collecting more than it paid out.  When OASDI was established, life expectancy was only 62 and benefits became payable at 65.  Ever-improving medical technology raised life expectancy, however, and folks came to expect they would live long enough to get a Social Security pension.  The change made in 1983 recognized that new reality.  Boomers would prepay part of their old age benefits.

Social Security then began accumulating a surplus.  It took in $95 billion more than it spent last year and ended 2011 with a $2.7 trillion surplus.   Of course, surpluses every year forever were not expected.  The accumulated surplus would at some point start to be drawn down and what was taken in would be brought into balance with what was paid out.  But now there’s a new factor; not only is life expectancy increasing, the birth rate is dropping.  That means fewer workers contributing to Social Security as well as more people getting benefits.  We now have 66% workers and 14% folks 65 or older.  The US Census Bureau projects that by 2050 we will have 60% workers and 21% folks 65 or older.  That means the ratio of contributors to benefiiciaries will plummet from 5:1 to 3:1.

Even so, our demographic prospects are better than most.  China has 74% workers and 9% 65 or older today but is projected to have 60% workers and 27% 65 or older in 2050.  Its working age population is projected to be 200 million lower by 2050 while ours will be 50 million higher.  Nonetheless, our steeply dropping ratio of contributors to beneficiaries must be acted upon and it will get worse unless we also increase job creation.  Social Security trustees project the program will start to pay out more in 2021 than it takes in and the surplus will be gone in 2033.  Only enough tax revenue will then be collected each year to pay about 75% of benefits.

An additional issue is that the Social Security surplus was supposed to be invested in interest-bearing federal bonds but there is no trust fund in the sense most of us imagine.  That $2.7 trillion surplus was already spent on other things.  It exists only as a part of our overall federal debt.  It is, of course, backed by the full faith and credit of the US government.

And there’s one more very important change to consider.  Social Security taxes increased in the last half century while income taxes shrank.  From 1961 through 2011, Social Security taxes grew from 3.1% of GDP to 5.5%.  Personal income tax dropped from 7.8% to 7.3%, most of that decrease benefitting those in the top 1% of incomes (the top rate fell under Reagan from 70% to 28%).  Corporate income tax fell from 4% to 1.2% (the rate fell from 50% of profits to 35%).  What happened, in other words, is corporate income tax fell by 2.8% while Social Security taxes increased by an almost identical 2.4% and since Social Security tax is capped, most of the burden of the tax increase was born by the bottom 90%.

So now it’s time for another major update of the Social Security program.  What could we do?  What should we do?  And when should we do what?

The AP recently used data from the Social Security Administration to calculate how much of the projected shortfall would be eliminated by various options. To highlight the urgent need for action, they also calculated what would have been eliminated if those options had been adopted in 2010.  I’ve also incorporated some data from David Cay Johnston.  First, what could we do and why should we do something soon?

1)  We could raise the payroll tax ceiling to generate more revenue. If we restore the Reagan standard that 90% of wages are taxed instead of today’s 83%, the tax would now apply to close to $200,000 of wages not $110,100.  Workers making $200,000 in wages would get a tax increase of $5,574.  If we entirely eliminate the ceiling and levy the tax on all wages, we would eliminate 72% of the shortfall. Two years ago, we would have eliminated 99%.

2)  We could also generate more revenue by raising the tax rate.  If we raise it by 0.1% a year for 20 years until it reaches 14.4% versus the current 12.4% (of which workers and employers each pay half but for 2011 and 2012, employees temporarily pay only 4.2%), workers making $50,000 a year would get a tax increase of $500. That would eliminate 53% of the shortfall. Two years ago, it would have wiped out 73%.

3) We could also get more tax revenue by increasing wages, which had fallen in 2010 back to the 1999 level, and by creating more jobs, which grew at only a fifth the rate of population increases since 2000.

4)  Or we could cut the outflow by raising the retirement age.  If we gradually raise it from 66 for full retirement benefits (67 for those born in 1960 or later) to 68 in 2033, that eliminates 15% of the shortfall. Two years ago, it would have eliminated 20%.  If we go to 69 in 2039 and 70 in 2063, that eliminates 37% of the shortfall. Two years ago, it would have eliminated half.

5)  We could also cut the growth of payouts by changing the inflation index that governs benefit increases.  If we use the Chained CPI, which assumes people change what they buy when prices increase, that would eliminate 19% of the shortfall. Two years ago, it would have eliminated 26%.

6)  Or we could reduce benefits for those with lifetime wages above the national average, currently about $42,000 a year.  If they still got more than lower paid workers but not as much more as now (the average monthly benefit for a new retiree is $1,264), we could eliminate 34% of the shortfall. Two years ago, we could have eliminated almost half.

Which of these options should we adopt?

Since the fundamental problem is the greatly increasing ratio of those getting pensions to those contributing to the program, option (4) seems appropriate.  The AP only calculated the result of raising retirement age from 67 to 70.  We could go further.  When Social Security was established, most folks expected to continue supporting themselves throughout their life.  The idea that most of us can retire is quite recent.  But the issue with this line of thinking is that those who most need the Social Security retirement benefit have low wage jobs that tend to be least suitable for older people.  Those with higher paying jobs can invest in their own pension plans, can more easily continue working while their body ages, can better mitigate the effects of aging, and are more likely to have work that remains attractive.  So maybe we should also adopt option (6) because higher income folks can increase their retirement benefits by investing in a supplementary plan.  Option (5) seems a gimmick, a way to avoid addressing the underlying challenge.

Our culture has changed enough in the last century (I hope) that winding down Social Security is not an option.  Most of us now need an employer so we can support ourselves, and we need to be well enough to work.  More people do become self-employed when there’s a persistently high lack of jobs but they will never be more than a minority in today’s economy.  Granted, we have many people living on the streets begging and/or thieving, we support by far the world’s greatest number of citizens in jail, and we have people benefitting from Social Security who should be working, but most of us now favor OASDI because we know people can’t always get a job.  If today’s Great Recession degenerates into another Great Depression, only the uber-rich may disagree.

So the more difficult question is to what extent we should increase Social Security’s revenue.  Recall that the payroll tax ceiling was higher under Reagan and we could (option 1) eliminate much of the projected shortfall by reinstating that level.  We could also secure the program’s finances by slowly raising the tax rate (option 2).  That seems reasonable since future beneficiaries are likely to receive more benefits for a longer time but I prefer option (1), eliminating the ceiling altogether, because that would partially reverse the 1961-2011 shift in tax collection from high to lower income folks.  Our society was not improved by that shift.

The greatest challenge is implied by option (3), increasing wages and creating more jobs.  It’s easier to imagine an accelerating reduction in the number of jobs for humans as more and more jobs can be done by computers and robots.  I touched on this in other posts and will return to it in more depth.  Planning for society with only the jobs that will still be available to humans in 2050 may be our greatest strategic challenge.  But today we need to address the more immediate problem, preventing Social Security from being defunded.

High Unemployment -> Lower Earnings -> Further Economic Decline

At 15% of the civilian labor force, total unemployment was down last month from its 17% high in October 2009, but it was still almost twice as high as before it rocketed up from the start of 2008.

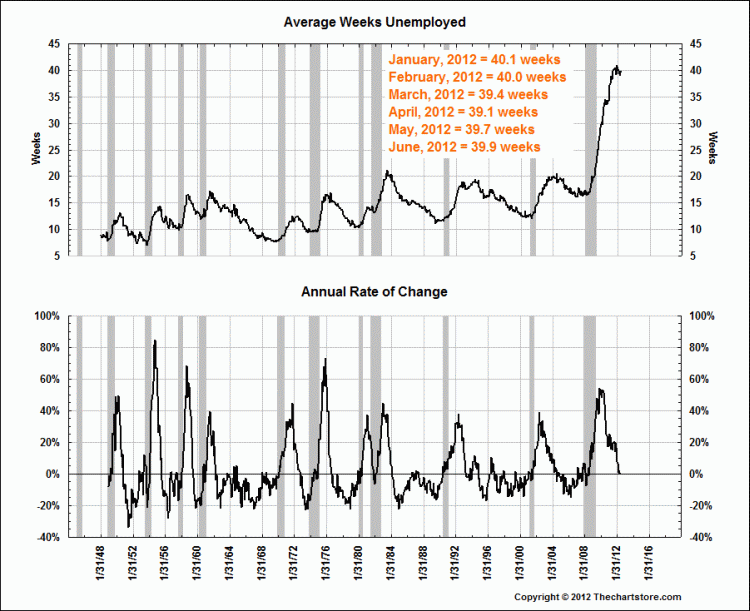
At 40 weeks last month, the average number of weeks unemployed has not changed this year after increasing sharply from less than half that level at the start of 2008.  The rate of change was very high during 2008.  It  dropped rapidly since the start of 2010 to stabilize at the current exceptionally high level.

Employment continues to drop in federal, state and local governments, all of which get less tax revenue because our economy is in recession.  They account for a little under 17% of total non-farm payroll.  In the goods producing sector which accounts for 14% of total non-farm payroll, we see 2% growth in manufacturing from one year ago.  In the service sector, 70% of total non-farm payroll, we see 3% growth in professional and business services, 2% in education and health, 2% in leisure and hospitality, and a small drop in information services.

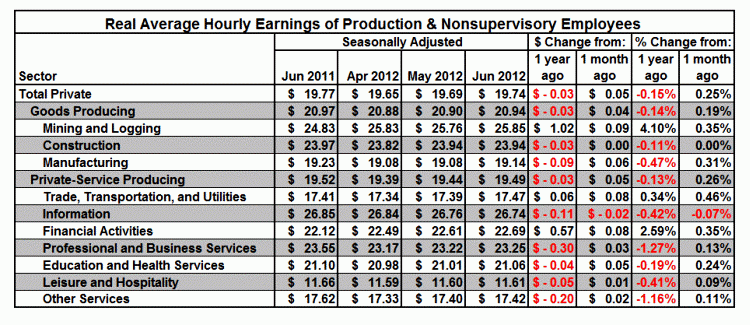
Persistently high unemployment has driven average hourly earnings down from a year ago.  The only exceptions are mining and logging, the second highest paid sector, which is up 4%, financial activities up 3%, and trade, transportation and utilities, the largest individual sector payroll, which is up 0.34%.

Professional and business services, the sector with the highest payroll growth, had, at 1.27%,  the greatest drop in average earnings from a year ago.  Manufacturing, the highest payroll growth goods-producing sector, had the next highest drop in average earnings, down 0.47% from a year ago.   Information services, the only service sector where payroll dropped, had the next highest decline in average hourly earnings, 0.42%.  That is almost identical to the 0.41% drop in average hourly earnings for the sector where average earnings are by far the lowest, leisure and hospitality.

Continued tax cuts will drive continued cuts in government payrolls, which will worsen our economic decline.   People without earnings can spend only what is transferred from those who do.   We must restructure our federal budget as I’ve noted in posts at http://usaturnaround.wordpress.com/ But as I’ve also noted there, we must at the same time restructure our economy.  We must create more jobs.  Without jobs there are no earnings, and without earnings there is no economy.

The big question is what kind of jobs in which sectors?  More and more jobs can be done at lower cost by workers in other countries, or by machines.  Businesses will, and should, continue to cut their high cost payrolls.  They have no incentive to form strategies to increase  US payrolls.  Politicians do have that incentive but chiefly in the short term, between now and their next election.  That is OK when the world is not changing but this is not such a time.  We must figure out how our society and economy should respond to currently unfolding great changes, identify the projects to achieve that transformation, and mobilize our workforce.

I began to explore this at the end of my previous post, “Monetary Policy, Fiscal Policy – What to Do?” at  http://martinsidwell.com/?p=117 and will continue.