“Four Colly Birds,

three French hens, two turtledoves and a partridge in a pear tree.”  This old Christmas song was written when the blackbird was food along with the hen, turtledove and partridge.  Colly in Old English means ‘black’ hence ‘colliery’ meaning coal mine and colly bird meaning blackbird.  Blackbirds were gourmet food in those days.  In “Sing a Song of Sixpence” 24 of them are baked in a pie.  So here, as thought-provoking fare, are four colly charts.

Fed Tax and Spending vs GDP

The first one shows Federal spending, the red line, and revenue (taxes), the blue one, in relation to GDP, the overall economy.  Spending is now 24% of GDP, higher than its ~22% average for the past few decades while revenue is substantially lower than spending at 17% of GDP and lower than its ~19% average over the past few decades.  This chart illustrates two of our three big problems, too high spending and too low taxes.  Our third problem (which I haven’t illustrated because I want only four charts) is economic growth that’s too slow to grow us out of the revenue and spending problems.   Slamming on the brakes to fix the deficit would make all three problems worse.

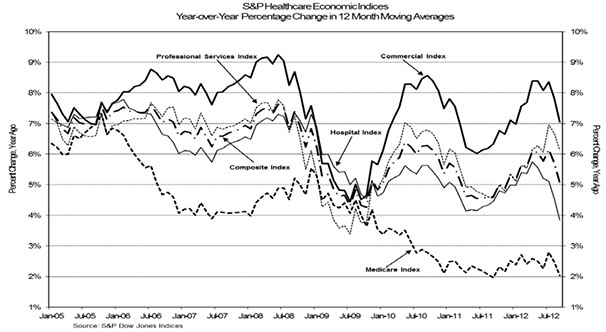
Health Care Indices

Where to cut spending?  Medicare?  We keep hearing that’s out of control.  The second chart suggests otherwise while also showing that our overall healthcare spending is unsustainable .  Medicare spending is now growing at an annual rate of 2%, right around the upper end of forecast GDP growth.  It was more than 7% six years ago.  Overall healthcare spending, however, (the composite index), which was also increasing 7% then is still growing 6% to 7%, an unaffordable burden on our economy.  Cutting Medicare, the only part of our healthcare system that is growing at an affordable rate, would increase that burden.

Labor vs Capital Share of Nonfarm Business

Where to raise revenue?  Wage-earners?  The third chart shows that after holding fairly steady at around 65% for the half century following WW2, labor’s share of non-farm business spending has, for more than a decade, been dropping fast.  It’s now around 57%.  What is correspondingly growing is capital spending.  Workers of all kinds are being replaced by computers and robots, not just by lower paid workers in other countries.  They, too, are being replaced by technology.  Capital investment is especially favorable now because interest rates have been driven so low.

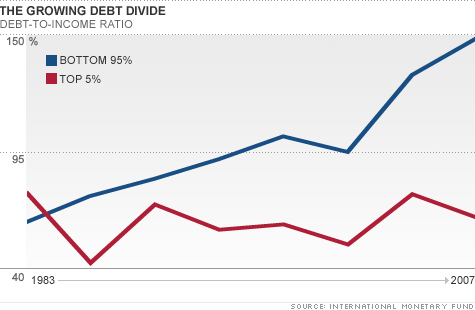
Debt v Income Tp and Bottom Quintile

The fourth chart shows that even though low interest rates are attractive to all spenders (especially governments), they are not helping everyone equally.  Debt (also interest payments, therefore) as a percentage of income is growing rapidly for those with incomes in the bottom 5%.  That’s because their living expenses keep growing but their incomes do not.  That will not change for the better in a very slowly growing economy.

Conclusions: (1)  Here, too, there is no silver bullet.  (2) We’ll shoot ourselves in the foot (at best) if we act as if there is one.

Social Security – Past and Future Changes

Social Security was originally established as insurance.  The Old-Age, Survivors, and Disability Insurance Act (OASDI) was for those who became unable to support themselves.  At that time, during the Great Depression, the poverty rate among senior citizens was over 50%.  OASDI became a pension plan a half century later when in 1983, President Reagan sponsored an increase in Social Security taxes, changing the program from pay-as-you-go to collecting more than it paid out.  When OASDI was established, life expectancy was only 62 and benefits became payable at 65.  Ever-improving medical technology raised life expectancy, however, and folks came to expect they would live long enough to get a Social Security pension.  The change made in 1983 recognized that new reality.  Boomers would prepay part of their old age benefits.

Social Security then began accumulating a surplus.  It took in $95 billion more than it spent last year and ended 2011 with a $2.7 trillion surplus.   Of course, surpluses every year forever were not expected.  The accumulated surplus would at some point start to be drawn down and what was taken in would be brought into balance with what was paid out.  But now there’s a new factor; not only is life expectancy increasing, the birth rate is dropping.  That means fewer workers contributing to Social Security as well as more people getting benefits.  We now have 66% workers and 14% folks 65 or older.  The US Census Bureau projects that by 2050 we will have 60% workers and 21% folks 65 or older.  That means the ratio of contributors to benefiiciaries will plummet from 5:1 to 3:1.

Even so, our demographic prospects are better than most.  China has 74% workers and 9% 65 or older today but is projected to have 60% workers and 27% 65 or older in 2050.  Its working age population is projected to be 200 million lower by 2050 while ours will be 50 million higher.  Nonetheless, our steeply dropping ratio of contributors to beneficiaries must be acted upon and it will get worse unless we also increase job creation.  Social Security trustees project the program will start to pay out more in 2021 than it takes in and the surplus will be gone in 2033.  Only enough tax revenue will then be collected each year to pay about 75% of benefits.

An additional issue is that the Social Security surplus was supposed to be invested in interest-bearing federal bonds but there is no trust fund in the sense most of us imagine.  That $2.7 trillion surplus was already spent on other things.  It exists only as a part of our overall federal debt.  It is, of course, backed by the full faith and credit of the US government.

And there’s one more very important change to consider.  Social Security taxes increased in the last half century while income taxes shrank.  From 1961 through 2011, Social Security taxes grew from 3.1% of GDP to 5.5%.  Personal income tax dropped from 7.8% to 7.3%, most of that decrease benefitting those in the top 1% of incomes (the top rate fell under Reagan from 70% to 28%).  Corporate income tax fell from 4% to 1.2% (the rate fell from 50% of profits to 35%).  What happened, in other words, is corporate income tax fell by 2.8% while Social Security taxes increased by an almost identical 2.4% and since Social Security tax is capped, most of the burden of the tax increase was born by the bottom 90%.

So now it’s time for another major update of the Social Security program.  What could we do?  What should we do?  And when should we do what?

The AP recently used data from the Social Security Administration to calculate how much of the projected shortfall would be eliminated by various options. To highlight the urgent need for action, they also calculated what would have been eliminated if those options had been adopted in 2010.  I’ve also incorporated some data from David Cay Johnston.  First, what could we do and why should we do something soon?

1)  We could raise the payroll tax ceiling to generate more revenue. If we restore the Reagan standard that 90% of wages are taxed instead of today’s 83%, the tax would now apply to close to $200,000 of wages not $110,100.  Workers making $200,000 in wages would get a tax increase of $5,574.  If we entirely eliminate the ceiling and levy the tax on all wages, we would eliminate 72% of the shortfall. Two years ago, we would have eliminated 99%.

2)  We could also generate more revenue by raising the tax rate.  If we raise it by 0.1% a year for 20 years until it reaches 14.4% versus the current 12.4% (of which workers and employers each pay half but for 2011 and 2012, employees temporarily pay only 4.2%), workers making $50,000 a year would get a tax increase of $500. That would eliminate 53% of the shortfall. Two years ago, it would have wiped out 73%.

3) We could also get more tax revenue by increasing wages, which had fallen in 2010 back to the 1999 level, and by creating more jobs, which grew at only a fifth the rate of population increases since 2000.

4)  Or we could cut the outflow by raising the retirement age.  If we gradually raise it from 66 for full retirement benefits (67 for those born in 1960 or later) to 68 in 2033, that eliminates 15% of the shortfall. Two years ago, it would have eliminated 20%.  If we go to 69 in 2039 and 70 in 2063, that eliminates 37% of the shortfall. Two years ago, it would have eliminated half.

5)  We could also cut the growth of payouts by changing the inflation index that governs benefit increases.  If we use the Chained CPI, which assumes people change what they buy when prices increase, that would eliminate 19% of the shortfall. Two years ago, it would have eliminated 26%.

6)  Or we could reduce benefits for those with lifetime wages above the national average, currently about $42,000 a year.  If they still got more than lower paid workers but not as much more as now (the average monthly benefit for a new retiree is $1,264), we could eliminate 34% of the shortfall. Two years ago, we could have eliminated almost half.

Which of these options should we adopt?

Since the fundamental problem is the greatly increasing ratio of those getting pensions to those contributing to the program, option (4) seems appropriate.  The AP only calculated the result of raising retirement age from 67 to 70.  We could go further.  When Social Security was established, most folks expected to continue supporting themselves throughout their life.  The idea that most of us can retire is quite recent.  But the issue with this line of thinking is that those who most need the Social Security retirement benefit have low wage jobs that tend to be least suitable for older people.  Those with higher paying jobs can invest in their own pension plans, can more easily continue working while their body ages, can better mitigate the effects of aging, and are more likely to have work that remains attractive.  So maybe we should also adopt option (6) because higher income folks can increase their retirement benefits by investing in a supplementary plan.  Option (5) seems a gimmick, a way to avoid addressing the underlying challenge.

Our culture has changed enough in the last century (I hope) that winding down Social Security is not an option.  Most of us now need an employer so we can support ourselves, and we need to be well enough to work.  More people do become self-employed when there’s a persistently high lack of jobs but they will never be more than a minority in today’s economy.  Granted, we have many people living on the streets begging and/or thieving, we support by far the world’s greatest number of citizens in jail, and we have people benefitting from Social Security who should be working, but most of us now favor OASDI because we know people can’t always get a job.  If today’s Great Recession degenerates into another Great Depression, only the uber-rich may disagree.

So the more difficult question is to what extent we should increase Social Security’s revenue.  Recall that the payroll tax ceiling was higher under Reagan and we could (option 1) eliminate much of the projected shortfall by reinstating that level.  We could also secure the program’s finances by slowly raising the tax rate (option 2).  That seems reasonable since future beneficiaries are likely to receive more benefits for a longer time but I prefer option (1), eliminating the ceiling altogether, because that would partially reverse the 1961-2011 shift in tax collection from high to lower income folks.  Our society was not improved by that shift.

The greatest challenge is implied by option (3), increasing wages and creating more jobs.  It’s easier to imagine an accelerating reduction in the number of jobs for humans as more and more jobs can be done by computers and robots.  I touched on this in other posts and will return to it in more depth.  Planning for society with only the jobs that will still be available to humans in 2050 may be our greatest strategic challenge.  But today we need to address the more immediate problem, preventing Social Security from being defunded.

High Unemployment -> Lower Earnings -> Further Economic Decline

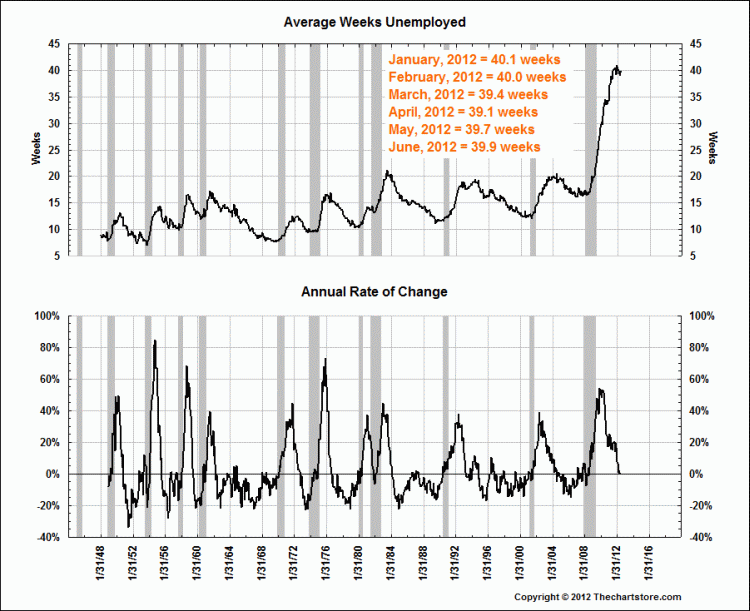
At 15% of the civilian labor force, total unemployment was down last month from its 17% high in October 2009, but it was still almost twice as high as before it rocketed up from the start of 2008.

At 40 weeks last month, the average number of weeks unemployed has not changed this year after increasing sharply from less than half that level at the start of 2008.  The rate of change was very high during 2008.  It  dropped rapidly since the start of 2010 to stabilize at the current exceptionally high level.

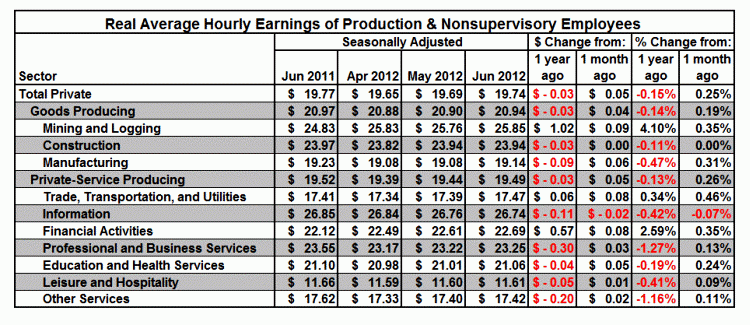
Employment continues to drop in federal, state and local governments, all of which get less tax revenue because our economy is in recession.  They account for a little under 17% of total non-farm payroll.  In the goods producing sector which accounts for 14% of total non-farm payroll, we see 2% growth in manufacturing from one year ago.  In the service sector, 70% of total non-farm payroll, we see 3% growth in professional and business services, 2% in education and health, 2% in leisure and hospitality, and a small drop in information services.

Persistently high unemployment has driven average hourly earnings down from a year ago.  The only exceptions are mining and logging, the second highest paid sector, which is up 4%, financial activities up 3%, and trade, transportation and utilities, the largest individual sector payroll, which is up 0.34%.

Professional and business services, the sector with the highest payroll growth, had, at 1.27%,  the greatest drop in average earnings from a year ago.  Manufacturing, the highest payroll growth goods-producing sector, had the next highest drop in average earnings, down 0.47% from a year ago.   Information services, the only service sector where payroll dropped, had the next highest decline in average hourly earnings, 0.42%.  That is almost identical to the 0.41% drop in average hourly earnings for the sector where average earnings are by far the lowest, leisure and hospitality.

Continued tax cuts will drive continued cuts in government payrolls, which will worsen our economic decline.   People without earnings can spend only what is transferred from those who do.   We must restructure our federal budget as I’ve noted in posts at http://usaturnaround.wordpress.com/ But as I’ve also noted there, we must at the same time restructure our economy.  We must create more jobs.  Without jobs there are no earnings, and without earnings there is no economy.

The big question is what kind of jobs in which sectors?  More and more jobs can be done at lower cost by workers in other countries, or by machines.  Businesses will, and should, continue to cut their high cost payrolls.  They have no incentive to form strategies to increase  US payrolls.  Politicians do have that incentive but chiefly in the short term, between now and their next election.  That is OK when the world is not changing but this is not such a time.  We must figure out how our society and economy should respond to currently unfolding great changes, identify the projects to achieve that transformation, and mobilize our workforce.

I began to explore this at the end of my previous post, “Monetary Policy, Fiscal Policy – What to Do?” at  http://martinsidwell.com/?p=117 and will continue.


Capitalists and Other Psychopaths

A recent piece in the New York Times, “Capitalists and Other Psychopaths”, achieves lift-off from: “4% of a sample of corporate managers met a clinical threshold for being labeled psychopaths, compared with 1% for the overall population”.  Buried in this horse-shit are a pony the author points to and a horse he overlooks.

The horse-shit:  An earlier version of the piece said 10% of people who work on Wall Street are clinical psychopaths.  It also failed to note the study’s disclaimer that the sample, 203 corporate professionals, was not representative.  The writer had a conclusion and failed to respect the data.  The sample is both not representative and too small – 1% of 203 is only two people.  What he wanted to say is the statistics are unsurprising because “Wall Street is capitalism in its purest form, and capitalism is predicated on bad behavior”.  He offers a jumble of factual examples – accounting frauds, environmental damage and so on – that also fail to support his conclusion.  Frauds are crimes.  Crimes are not unique to capitalism but occur in every part of every society.  Environmental damages are market externalities (e.g. pollution costs the public not the polluter so it must be regulated).  Capitalism, like every other system, does not resolve every issue for any society.

The pony:  The writer’s anger about “so-called job creators who deserve our gratitude not our envy” leads him to some very important points for tax policy:

  • Entrepreneurs use wealth to create jobs for workers, workers use labor to create wealth for entrepreneurs
  • Neither party aims to benefit the other but both do gain from the exchange
  • Most of the rich are not entrepreneurs.  They are executives of established corporations or people who inherited money

The horse:  It may not be 1% but psychopaths are plentiful at every level of society.  This writer is angered by rich ones, others by poor ones.  This writer admires moms who single-handedly support themselves and raise good kids.  Others focus on successful entrepreneurs who become philanthropists or those born with nothing who never take a handout.  We see demons, “Fatcat CEOs”, “Welfare Queens” and such, and heroes, “Job-creating Investors”, “Fingers-Worked-To-The-Bone Grandparents” and so on.  Demons and heroes do manifest reality, that’s why they have power, but all they do is point out aspects of reality.  Our job is not to hate or worship them.  We must get past the entertainment they provide and take the indicated actions.

It really doesn’t matter if 4% or some other percentage of the 1% who have most of the wealth in our society are psychopaths, or if 1% or some other percentage of the other 99% are psychopaths.  Every society always has been sprinkled with psychopaths.  Cultures throughout the world and from the dawn of history have depended on an ethic of reciprocity expressed as a Golden Rule, “treat others as you would like to be treated” and Silver Rule, “do not treat others in ways you would not like to be treated”.  Behavior according to those rules is self-reinforcing.  It works automatically in all people blessed with empathy.  But societies must legislate and enforce the Silver Rule because it does not work for psychopaths who by definition lack empathy.

In the same way, while Adam Smith’s great insight that free markets work automatically means the “invisible hand” should be allowed to work its magic, regulation is necessary for market externalities and those regulations must be enforced.

Tax Rates and Employment Rates

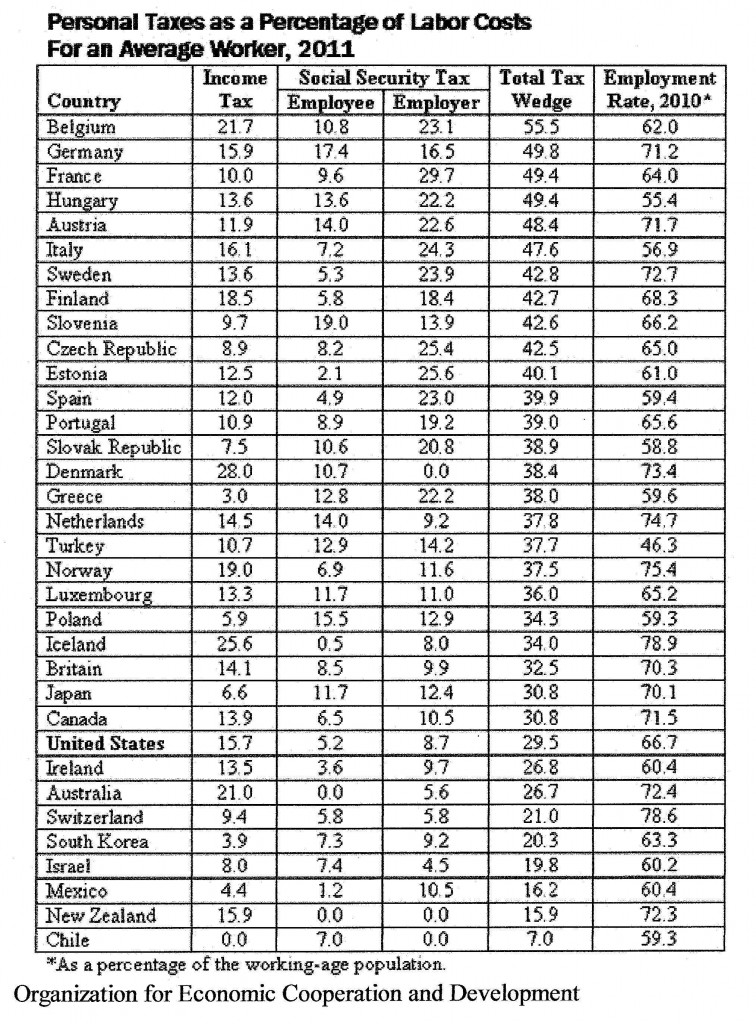
Many in Congress are pledged never to raise taxes.  They say we must, in fact, further cut the “tax wedge”, the difference between an employer’s cost for a worker and the employee’s after-tax reward.  The tax wedge grows when taxes go up so it costs more to employ workers at a given after-tax wage.  If taxes go down, it costs less to employ workers at the same after-tax wage.  That means to cut unemployment we should cut taxes, right?

New data from the Organization for Economic Cooperation and Development (OECD) show there is in fact no correlation between size of tax wedge and rate of employment.

The USA is a low-tax country with a tax wedge of 29.5%.  Three-quarters of OECD countries have a larger tax wedge on average workers.  The data in the last column is workers employed as a % of the working-age population, a better indicator of labor market health than unemployment rate, which fluctuates for many reasons and is counted in many ways.

Key take-aways:  Almost half the countries with a bigger tax wedge employ a larger percentage of their working-age populations than the USA.  More than half of those with a smaller tax wedge have lower employment ratios.

Hat-tip to Bruce Bartlett who held senior policy roles in the Reagan and George H.W. Bush administrations and served on the staffs of Representatives Jack Kemp and Ron Paul.  He concludes http://economix.blogs.nytimes.com/2012/05/01/taxes-and-employment/ by saying: “There is simply no evidence that cutting taxes at the present time will do anything to raise employment.”