Who Does Trump’s Tax Plan Benefit?


Who does the Republican tax proposal aim to benefit ?  Let’s examine its intentions, then look at an approach that extends some of its features and is progressive.

Clear intent:  Give more to the heirs of the very wealthy, e.g., President Trump.  The estate tax is eliminated entirely in six years, which greatly benefits the wealthiest 0.2% of the population.

Clear intent:  Continue to take less from wealthy hedge fund managers and private equity executives who will continue to be taxed at capital gains rates that are about half the ordinary income tax rate on profits they pay themselves via the carried interest loophole.

Clear intent:  Give more to the owners of partnerships, S corporations, and sole proprietorships, which are overwhelmingly owned by rich individuals like President Trump.  Income from them that is returned to the companies’ owners is now taxed at the same rates as wages and salaries but it would be taxed at a new 25% rate.   The Tax Policy Center (TPC) finds that the top 1% would receive 88% of the benefit with the 400 households with the highest incomes getting an average annual tax cut of $3.7 million.

Clear intent:  Give all those with high incomes more by eliminating the alternative minimum tax and raising the threshold for the 39.6% top rate on income (which was 70% in 1980) to $1 million for couples, up from $470,700 today.

Clear expectation with unclear intent:  Add at least $1.5 trillion to the federal debt over a decade (many economists think it will be more) by cutting the corporate tax rate from 35% to 20% without raising other taxes.  The cost of this debt will grow as interest rates rise so the intent could be to “starve the federal government of revenues, setting the stage for a frontal attack on core social programs such as Social Security and Medicare.”

Unclear intent:  The corporate tax rate is cut from 35% to 20%, which will save US corporations $2 trillion over the next ten years.  The great majority of economists believe shareholders would be the primary beneficiaries but Republicans say employee salaries would rise.

Treasury Secretary Mnuchin claims: “many, many economic studies show that more than 70% of the burden of corporate taxes are passed on to the workers.”  Congress’s non-partisan scorekeepers — the Congressional Budget Office and Joint Committee on Taxation — as well as Treasury’s Office of Tax Analysis have all assessed the empirical research as showing that only about a quarter or less of corporate taxes fall on workers, meaning that they would receive a quarter or less of the benefit of corporate tax cuts.

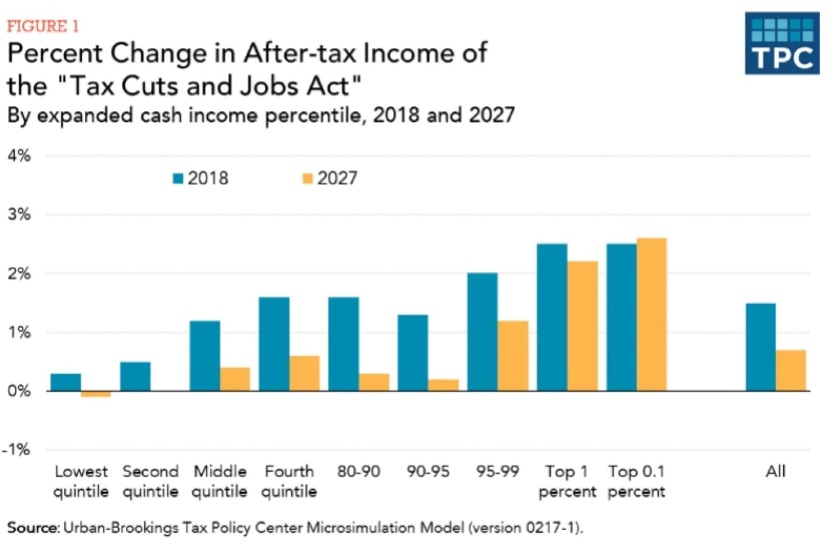
The Tax Policy Center estimates that over a third of the benefit would go to the top 1% and 70% to the top fifth.  By 2027, low- and moderate-income families with children would receive little or no tax cuts, and many would see tax increases while 80% of benefits would go to the top 1% of households and after-tax incomes of the bottom 80% would rise by less than half of one percent.

Unclear expectation:  The effect on middle and lower income families.  The plan roughly doubles the standard tax deduction but it repeals or reduces current tax deductions that chiefly benefit workers and middle-class people, including mortgage interest, state and local taxes, student loans, medical expenses, moving costs, and tax credits for retired and disabled people.

  • The standard deduction will be raised to $24,000 for couples and $12,000 for individuals but the $4,050 personal exemption  is eliminated
  • The mortgage interest deduction is unchanged for current homeowners, but is capped at $500,000, down from $1 million, for all future mortgages.
  • The deduction for state and local income/sales taxes would be eliminated.
  • The deduction for state and local property taxes would be capped at $10,000.

The Tax Policy Center (TPC) analyzed the change in after-tax income for the poor, middle class and rich and found the middle class would get a 1.2% boost to their after-tax income and the bottom 40% would get almost no benefit.  Their taxes would actually increase $10 to $20, on average, by 2027.
The Center for Budget and Policy Priorities assessed the intent of the plan in its original form when the top tax rate would have been 35%.  They estimated the overall results of that plan would be:

  • The top 1 percent, who make above $733,000 annually, would see average tax cuts of $90,000 in 2018, increasing their after-tax incomes by 5.9%.  They would receive about 45 percent of the total net tax cut.
  • The top one-tenth of 1 percent, who make over $3.4 million, would receive average tax cuts of $507,000 in 2018, raising their after-tax incomes by 7.2%.
  • This average increase in after-tax income for those in the middle fifth of the income spectrum would be 1.2%.
  • The bottom fifth would gain less than 0.5%.
  • People with annual incomes over $1 million would receive average tax cuts of $138,000 in 2018, compared to average tax cuts of $270 for households making below $75,000. Millionaires’ after-tax incomes would rise 6.4 percent in 2018, compared to a 0.9 percent increase for those making less than $75,000.

The Joint Committee on Taxation estimated the results of every detail of the plan but we do not need more detail to confirm that its purpose is to benefit the wealthy.

So let’s move on.  Is there a way to build on some of the Republican ideas to start reversing our society’s dangerously high inequality?

We use tax revenue to pay for services we want from our government.  The “we” who want those services is, to coin a phrase, “we the people” not also “we the legal entities such as corporations” so it would be more straightforward to tax the income and wealth only of people.

We could then focus just on the relative contribution each economic subset of people should contribute to the cost of government services that benefit us all.  We would still have vigorous disputes about relative contributions but we could better understand each others belief about what is fair.

Making that change might also encourage us to pay more attention to how much our government spends on each of its services.

We know what Social Security and Medicare cost us because we pay for those with dedicated taxes.  But most of us do not know that what we spend on our military activities dwarfs every other discretionary service and includes having our troops in 53 out of the 54 nations in Africa.

A better program might look like this:

  • Entirely eliminate taxes on businesses and tax only the income their owners derive from them.  Replace the lost revenue by:
  • Making income tax rates steeply more progressive, perhaps returning to the 1980 70% rate
  • Entirely eliminating preferred subcategories of income such as capital gains, pass-through and carried interest.  We would tax all income above, say, $12,000 per person, from all sources at the same rates.
  • Making the estate tax very steeply progressive on amounts above, say, $5 million (which my grandfather’s generation did to end the stranglehold of Britain’s aristocracy).

Some other things we could consider:  If we wanted to accelerate cutting the influence of our financial oligarchy we could also establish a wealth tax, similar to property tax but applied to all wealth.

We could also build on the Republican idea of cutting tax deductions that benefit some people over others. and entirely eliminate tax preferences, including mortgage interest, state and local taxes, student loans, medical expenses, moving costs, and tax credits for retired and disabled people.

We could raise the minimum wage if we believe the Republican theory that eliminating the tax on businesses would cause wages to rise.  We might raise them to the level where a head of household could support their family as they did before America needed to be made great again.

We could also explore new taxes such as this one and use those revenues to fund maintenance of the transportation and other infrastructure that we all depend on.

Summing up:  The Republican tax proposal contains some good ideas but the way they are structured would greatly benefit the very wealthy and do little or nothing for everyone else.  It would also greatly expand our debt whose cost will be born by us and future generations.

The promises made to sell the plan are spurious.  It can not be supported by anyone who understands it and is not wealthy and selfish.

But we do need a better tax system.  What do you think of the progressive approach above?  Don’t worry if it seems impossible.  If we are clear on what we want, we can figure out how to get there.

We the Easily Bamboozled – Tax Reform


We do need to change how we fund our government’s activities and how our economy distributes the wealth it creates.  But the tax plan now being revealed is not what we need.

Our President and Republican leaders keep telling us it is urgently necessary to lower corporate tax rates so companies can stay competitive.  It has become the party line.  As my Republican Senator Toomey’s website says:

“Our country’s current corporate tax rate of 35 percent is one of the highest in the developed world, far higher than the average 25 percent rate of our economic competitors. Without a significant reduction in business tax rates, the U.S. will never be the best place to invest and create jobs … The best economic stimulus for the middle class, who have seen their wages stagnate and tax bills rise over the last decade, is a well-paying job. Tax reform will help deliver on this goal with its focus on lower rates, investment, and growth.”

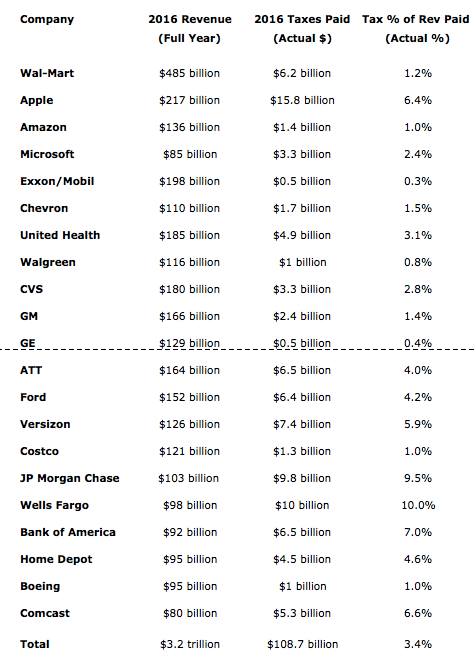
Really?  The 20 US companies that accounted for 20% of US GDP last year, meaning all our economic activity, paid taxes totaling only 0.6% of GDP and only 3.6% of all federal taxes (Source: Forbes).

Businesses pay taxes on profits not revenues, of course, but my point is that our theoretical corporate tax rate is not making our businesses less competitive or stifling their job creation.   That is not the motive behind this tax plan.

But before we get to that, what would this budget cost?  The fiscally conservative Committee for a Responsible Federal Budget estimates $2.2 trillion in lost revenue over a decade.  The tax cuts would total $5.8 trillion.  New revenues totaling $3.6 trillion resulting from “base broadening” would allegedly reduce the net loss to $2.2 trillion.

Treasury Secretary Mnuchin told us “The plan will pay for itself with growth”.  But we have seen over and over again, most recently in a multi-year “experiment” in the state of Kansas which its governor trumpeted as a “shot of adrenaline” to the state, that a tax cut plan that will pay for itself is a fantasy.

That fantasy cannot and will not ever come to pass.

So, what motivates this plan?   Who would benefit?  The Tax Policy Center estimates that 80% of the $5.8 trillion in tax cuts would benefit the richest 1 percent.

And who would lose?  55 million Americans would lose their tax deductions on what they save in tax-deferred 401k plans and what they pay in state and local taxes.   They are our middle class.

Those who earn less would be hit harder, losing government services eliminated to pay for the tax cut, which look to include about $1.5 billion in Medicare and Medicaid.

Would anyone other than those with very high incomes benefit from this plan?  Yes — their heirs.

This is a good budget if you want your kids to live under an aristocracy of folks like President Trump whose inheritance installed him among the plutocrats who bought our political establishment.

We do not have the leaders we should want.  Their plan is very far from what we need.

Pros and Cons of Income Inequality


Income inequality is a good thing but, as is proverbial, one can have too much.

We like having more and because working makes that possible, we’re motivated to work.  That’s a good thing because, although having more won’t necessarily make us happy, the way our society works requires us to work.

When there’s too much income inequality, however, when a tiny minority has most of the money, the others can’t keep buying enough and consumption drops.  Businesses start shedding workers, and money that would have been invested in production moves to secondary assets like stocks whose prices increase because of the new demand.

But enterprises underlying those secondary assets depend on the economy and because that is shrinking, those assets become increasingly over-valued.  When the discrepancy is recognized, the speculative bubble bursts.  Then all but the very rich are in trouble.

That happened in the Great Depression 80-odd years ago and, starting 8-ish years ago, it is happening again.  Our government contained the collapse more effectively this time although its effects continue, but we are now also experiencing a worsening systemic problem.

Our society depends on jobs to supply income, but jobs are disappearing.

What revived our economy from the Great Depression were economic policies that redistributed some of the wealth from the top.  Restoring buying power restored consumption, that restored investing in production, and that created more jobs — a virtuous spiral.   Those policies included Social Security, Medicare, high minimum wages, high marginal tax rates, and strong enforcement of financial regulations.  Eisenhower and Nixon supported and even extended parts of the system Roosevelt initiated that kept investment and consumption in balance.

Then economic policy reversed direction in the 1970s following dramatic cuts in the supply and corresponding increases in the price of oil.  The economy was wounded, according to the new theory, because there was not enough investment and too much consumption.  The indicated new policies included cutting the real value of the minimum wage, cutting welfare spending, cutting taxes on the wealthy, and deregulating the financial sector.  Inequality began to rise again.

That new policy direction was and still is embraced by both Democrats and Republican.  The political shift is detailed in this post but my aim here is to point not to a political but a fundamental change.

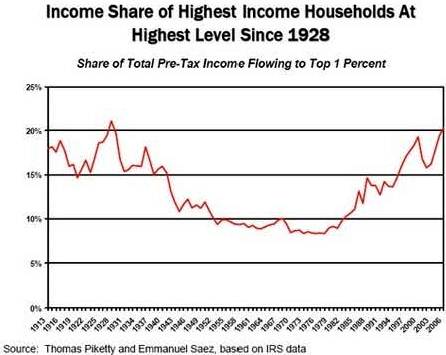
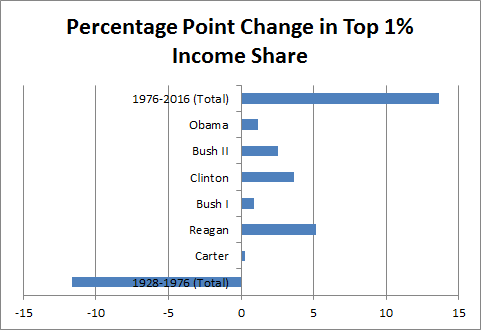
I included the leftmost chart below in my 2013 Economic Consequences of Inequality post.  We must also consider the one beside it from the World Wealth and Income Database.  Today’s income inequality and under-employment was brought to us by leaders of both political parties, none of which see that we are experiencing a second industrial revolution as momentous as the first.

Extreme Inequality

change-in-top-1-income-share-us-presidentsWhat has already happened is jobs previously done in America went where wages are lower.  What is happening at an increasing rate now is jobs done by humans are going to machines.
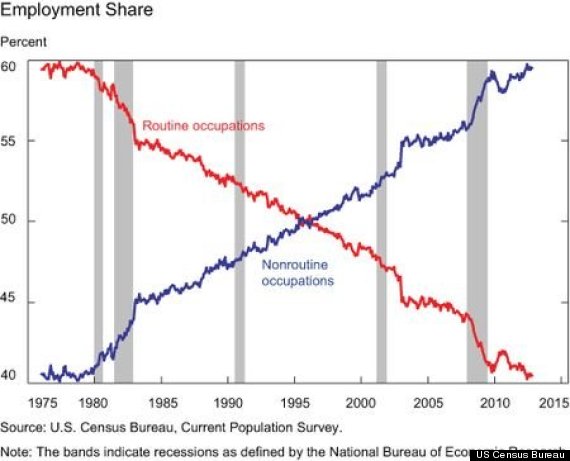
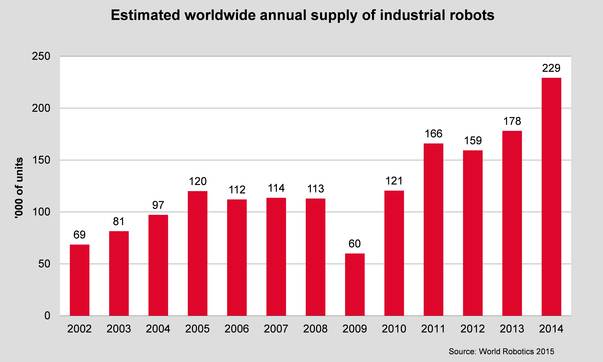
Economics researchers studying US Census Bureau data say half of current jobs (47%) can soon be done by machines and this study suggests 81% in the next few decades.  The schedule is arguable but the future of routine jobs is clear — they’re going away.

Routine vs Non-routine jobs

RobotsResearchers employing the quadrant chart tool I wrote about here assure us that non-routine jobs will remain beyond the reach of machines.
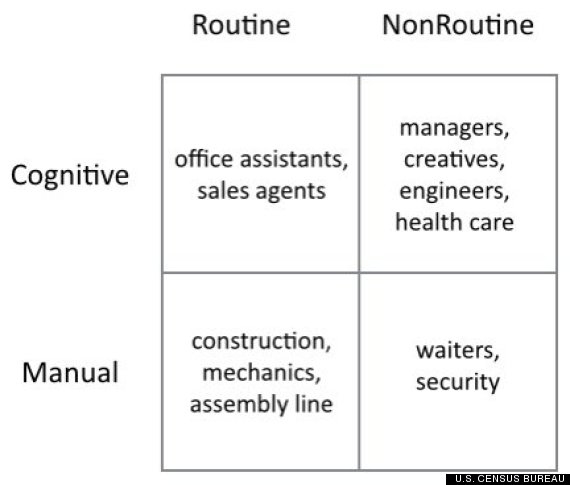
Watching our washing machine being repaired just now, I thought: “That’s something no machine could do. “  But the problem was diagnosed by phone, the part to be replaced was mailed here and washers could be designed to be serviced by robots.  In Japan where many are old enough to need assisted living, much of the care is already provided by smart machines.  Our physical, cognitive and emotional health care needs will increasingly be served by machines.  Robot waiters will attend us and security guards will protect us.  And so on.

Robots could even replace the guys on the freezing mud flats outside my window harvesting clams but it will probably not be worth the investment.  And there will always be jobs for thinking folks like us, right?  In fact, our lives will become ever easier as machines take over all our routine and physical tasks.

Work Sphere

Er… why do we imagine we can continue to out-think robots?   Could we not have told sagacious horses looking forward to similar benefits from the first industrial revolution that they never would learn to drive tractors?

Before that revolution 90% of Americans’ jobs were in agriculture, 3% now.  It didn’t happen suddenly.  Engines were used the same way as horses for fifty years before methods of farming changed at an increasing pace to exploit the new potential of engines.

We’re now in the second half of the second industrial revolution.  Computers began to be used for routine tasks more than seventy years ago and I was managing development of a communications grid based on the same technology as the Internet 45 years ago.  The great majority of jobs presently done by humans will again disappear.

What will happen when there are only jobs for a very few?  There must be a new foundation for the economy if there are too few new jobs for humans.  There will be no choice but to redistribute part of the profits from owners of machines to others so they can pay for the machines’ products and services.  There would otherwise be no profits.

Inevitable as it may be in the longer term, redistribution like that would, with good reason, be feared by the wealthy.  It could go too far.  The interim step, if the system dominated by “too big to fail” financial enterprises continues to collapse, will likely be a repeat of the Great Depression work programs.

We may at long last restore our transportation and other infrastructure on the way to an economic future whose structure we cannot yet discern.

Maslow Misapplied to Nations

I was excited 35 years ago to see the rewards for structuring data into quadrant charts.  That was for me!  And management consulting with those charts was fun, but I saw how misleading they can be and at last returned to product and business development.

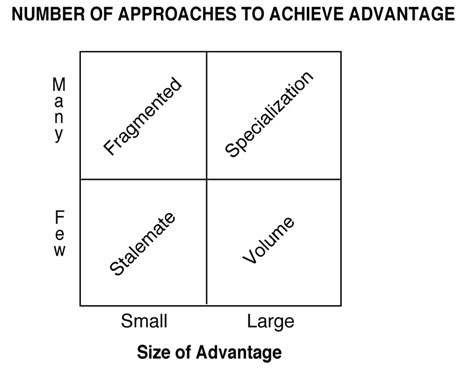
The chart tool began as a guide for business and product strategy, the idea being that you’re in trouble in the bottom left where your competitive advantages are few and small.  You must develop more and stronger advantages to soar to the profitable heavens on the top right.

BCG Advantage Matrix

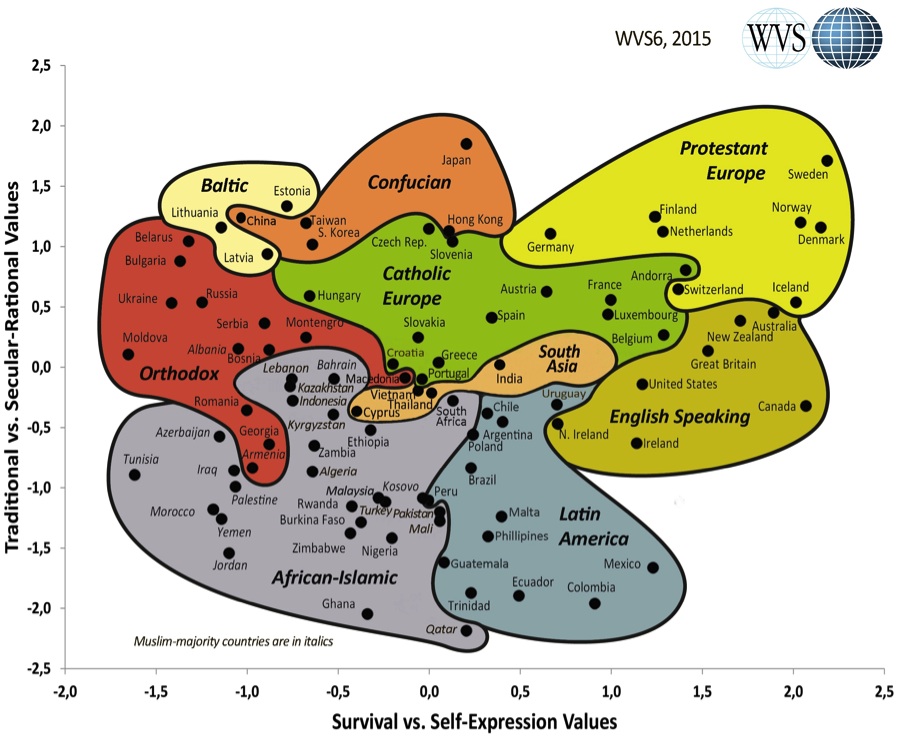
Learning how to use and not abuse that tool has continued to be useful.  What provoked this post is research from 1981 to 2014 that is well illustrated by this animation but misleadingly presented in chart in the Findings & Insights summary linked to on this page.

The religion-based labeling is accurate but, in the two-dimensional chart context where the goal is to move from bottom left to top right, it is misleading.

And in this article by a different researcher the data is naively misinterpreted to suggest that capitalism transforms national values toward the political left.

So this is an example of tool abuse.  The data points are real, the research is valuable and the animation of changes over time is meaningful.  But the complex underlying reality is distorted by a static chart labeled in this way.

Nations' Survival vs Self-espression

The World Values Survey (WVS) researchers describe the two dimensions as follows:

  • Traditional values emphasize religion, parent-child ties, deference to authority, traditional family values and national pride
  • Secular-rational values place less emphasis on religion, traditional family values and authority
  • Survival values emphasize economic and physical security, are relatively ethnocentric and feature low levels of trust and tolerance
  • Self-expression values emphasize environmental protection, tolerance, and participation in economic and political decisions

The researchers say the data show that as a country moves from poor to rich, it also tends to move from traditional to secular-rational.  The move is a tendency not inevitable because values are also highly correlated with long-established cultures.

And there is movement in both directions over time.  The USA, for example, is in 1989 a little toward the traditional end and quite far toward self-expression, then it grows more traditional over the next decade, less so in the next, then steadily less traditional and less concerned with self-expression.

The writer claiming that capitalism transforms national values so nations labeled Islamic will, if they embrace capitalism, naturally move toward Protestant heaven, confuses correlation with causation.

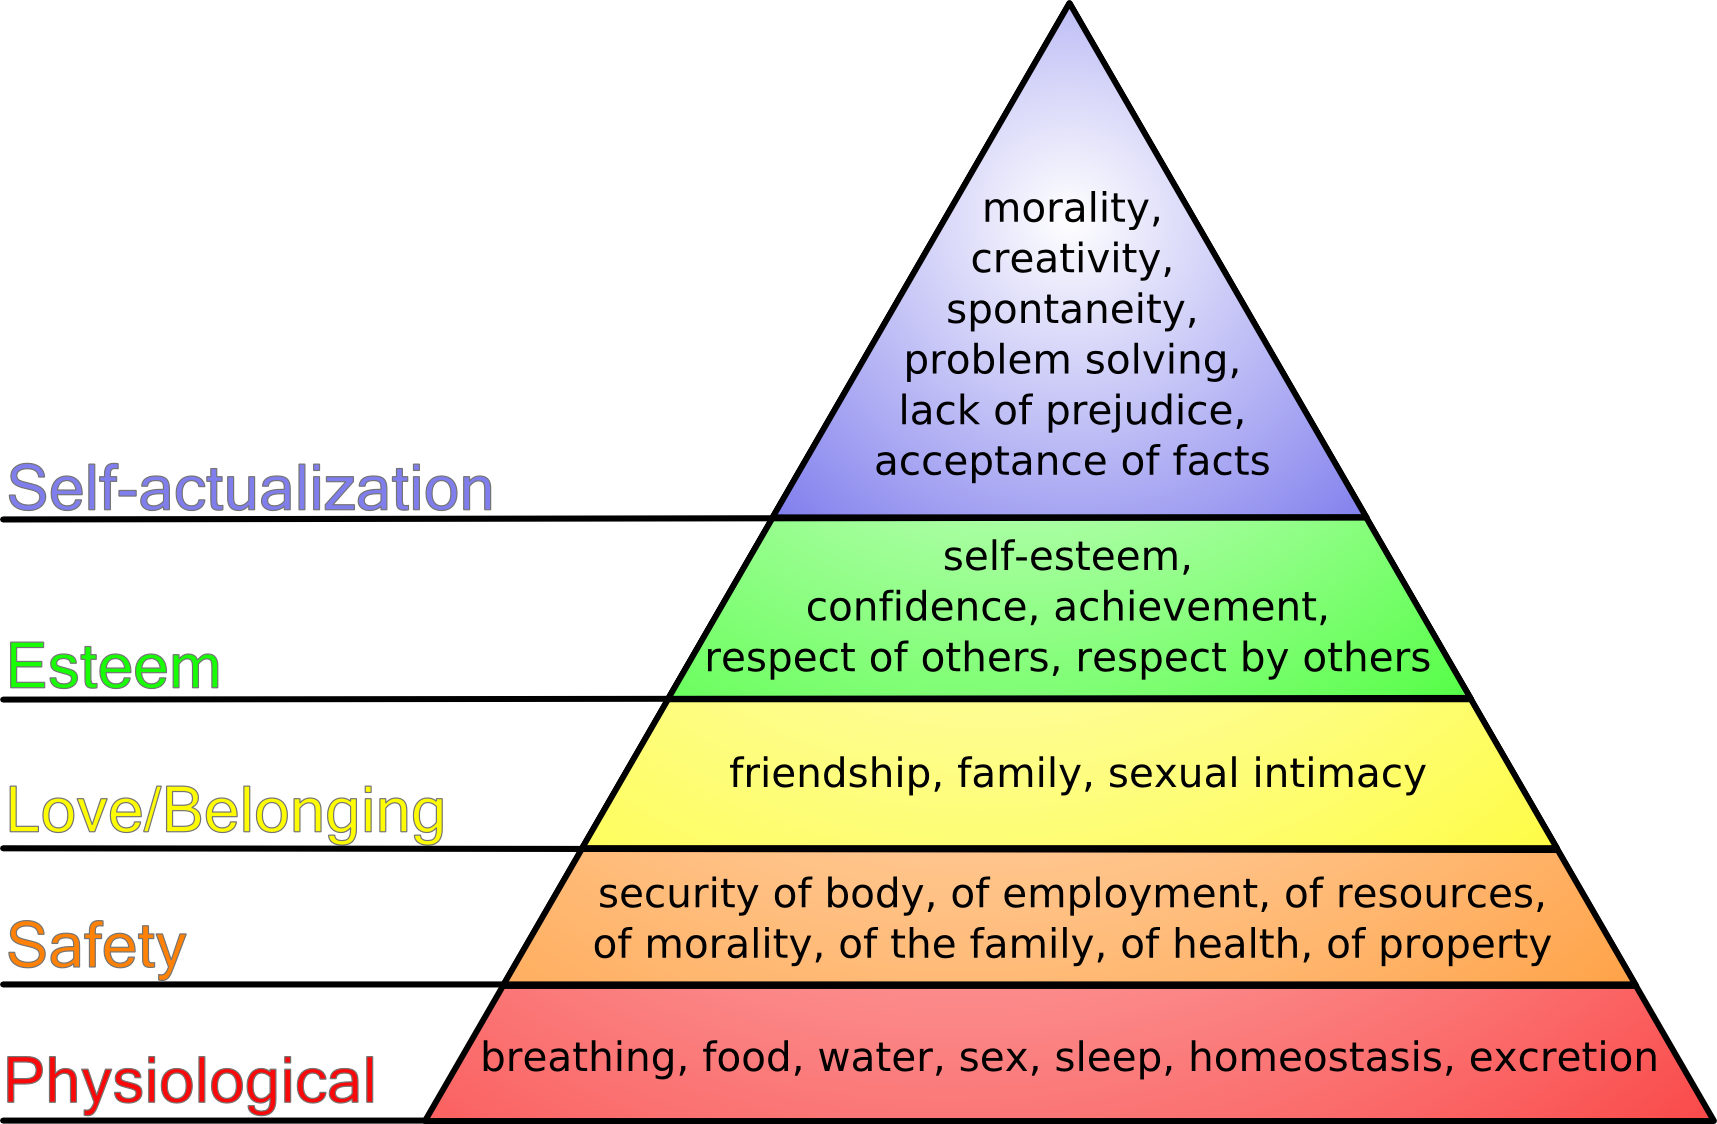
His explicit blunder is conceptualizing nations as people to which Maslow’s “Hierarchy of Needs” apply.

Maslow's_hierarchy_of_needs

Maslow illustrates how, if we have no food, all we care about is getting our next meal, but once we have that, we start caring about how to get the next meal and the one after that, and if we secure a reasonably dependable supply of basic needs we put effort into friendships, then start working for the respect of others, and finally devote effort to self-actualization.

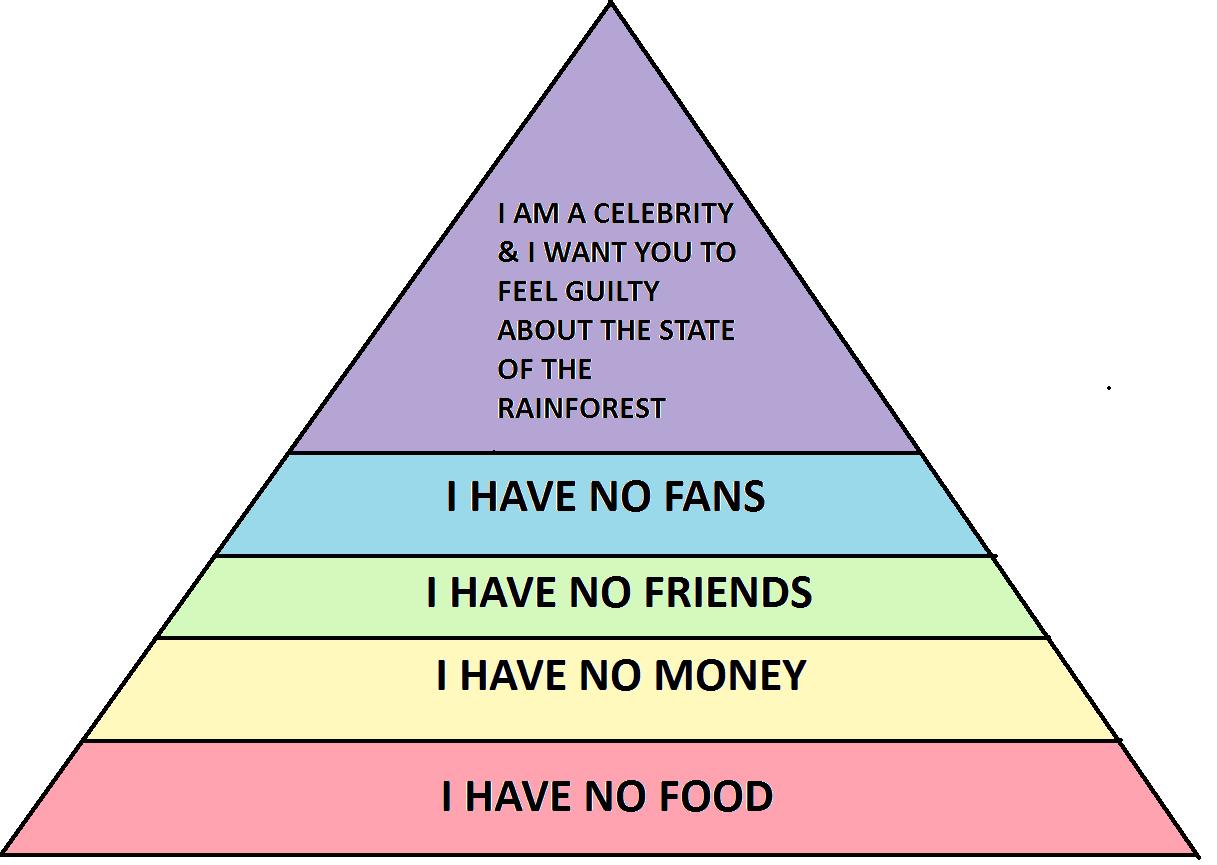
Here’s a simpler way to see what Maslow was driving at (hat tip to Lexy):

Lexys-Version-of-Maslow

What Maslow’s hierarchy does not show is how circumstances impact the motivation of nations.  It can’t because nations are not people.  They are made up of people whose situations can be very diverse.

This comment on the naive article (click on the link and wait for it to scroll down) summarizes what the research actually illuminates:  “Economic and political systems, and culture/psychology interact with each other in both directions … autonomous individuals create capitalism, safety creates capitalism, peace creates capitalism.”

The top left is not unalloyed heaven because “increasing empathy and mutual respect [and] the breakdown in social capital go hand in hand with secularization and the domination of the market.”

And good governance is a prerequisite: “the state monopoly of coercion helped create the safety required for the large social networks of trust, and individual autonomy.”

According to the US Census Bureau, 15%, i.e., 47 million Americans are living in poverty meaning “a lack of those goods and services commonly taken for granted by members of mainstream society.”  That includes more than one in five of all chil­dren under age 18.

The WVS research, excellent as it is, can tell us nothing about the value those 47 million Americans place on traditional vs secular-rational values.

And we would be utterly mistaken to imagine they over-value self-expression relative to survival.

Evaluation of War on Terror Strategy

Our War on Terror strategy (see this) implies readiness for large and small scale action in multiple theaters throughout Africa, the Middle East and Central Asia, Southeast Asia, and Northern and Western South America.  How likely is its success, how long will it take, can we afford the cost, and is there a better approach?

The goal of the strategy is to eliminate Islamic “holy war” terrorists who might attack us from anywhere in the world.  It is unachievable.  That kind of threat can not be ended, only mitigated and endured.  Military action is in fact counter-productive because the collateral destruction creates more terrorists and strengthens their support.  Even if we could utterly destroy al Qaeda, we could not declare victory because we declared war on all Muslim terrorists.  Since there are over a billion Muslims, there will always be a few Muslim extremists just as there will always be some who are Christian.

Response to aggression should always be proportional to the threat, and it must be able to succeed.  Our response is massively disproportional and it can never succeed.

A strategy of unending military engagement everywhere would exhaust any nation.  That strategy for the USA predates the War on Terror.  We spend more on military activities than the next 20 nations combined, which is half our total expected Federal tax revenue.  The cost of our already high Federal debt must become unaffordable when our spending is persistently so much higher than revenue.  No nation can afford war that is permanent.  We cannot afford this strategy’s cost.

And the strategy will make us permanently less free.  When we go to war to preserve our liberty, we willingly forgo some of the freedoms we enjoy in everyday life, expecting them to be restored when victory is achieved.  If victory never can be won, those freedoms never will be regained.

Finally, the strategy creates unwarranted suffering for our own people.  Enormously more of our troops are killed than the number of US citizens threatened by terrorists and enormously more of them suffer physical and/or psychological damage from which they will never recover.  Caring for them has a high dollar cost.  Far more important, we are wrong to demand their sacrifice.

So, we are forcing future generations to pay for a war that cannot succeed and which limits the very freedoms we claim it will preserve.  How did this happen?

For the first half century after we emerged as a great power early in the 20th century, we acted overseas only after deliberation and then with decisive power.  The great good fortune of our geography gave us time to prepare and sufficient resources to do so.  We entered WW1 and WW2 when we were ready and we brought about rapid victory.

We radically changed strategy following WW2.  We began managing the world whether or not our immediate interests were threatened in any particular situation.  We took the lead in Korea, which the Allies had split into two nations at the end of WW2.  Then we initiated a long, bloody and fruitless war in Vietnam that spilled over into Laos and Cambodia.  And we established a nuclear strategy of “mutually assured destruction” which we did not change after Soviet Russia, our only military rival, collapsed and we no longer faced any existential threat.

In response to the 9/11 attack on two mainland USA targets by al Queda terrorists, we initiated not just detective work but war, as if we had been attacked by a nation.  We invaded Iraq even though we knew there was no Iraqi involvement in the attacks.  We heavily bombed Afghanistan where al Queda’s leaders were based and inserted ground forces there.  After Al Queda’s command cell relocated to Pakistan, we greatly increased our activities in Afghanistan.  By about 2004 we had lost focus on what our War on Terror was intended to achieve.

No satisfactory reason for our invasion of Iraq emerged, civil war broke out, and opposition to us was so strong by 2004 that we could only maintain our presence by allying with our enemies.  Furthermore, by destroying Iraq’s power we had eliminated the only regional balance against Iran, which we now view as our enemy.  After entering Afghanistan to disrupt al Qaeda’s leadership, we drifted into fighting the Taliban, a different and far more costly objective that required massive force.  We then, as in Iraq, set a far longer term objective, building a democratic society.  When we installed the Karzai government, the Taliban retreated to the mountains to wait us out.  We are now downsizing our presence but the end of our war in Afghanistan is indefinitely far distant.

Meanwhile, we began to capture and monitor all electronic communications to identify terrorists.   Believing we were threatened by potentially massive new attacks, we could only hope to avert them by monitoring all communications between everyone, and storing everything so we could monitor earlier communications of new suspects.  We partially suspended habeas corpus so suspects could be jailed indefinitely without trial.  We began torturing them, illegal in the USA even in wartime, in camps overseas.  We began killing suspects without due process.  The President can now direct even US citizens to be killed.

In the past 10 years we have killed around 3,000 terrorists and civilians with drones in Pakistan, Somalia, Yemen and elsewhere, i.e., inside nations on which we have not declared war, and the Joint Special Operations Command (JSOC), which killed bin Laden, has established commando teams in Africa for operations throughout NE Africa and the Middle East.  Attorney General Holder asserts: “Our legal authority is not limited to the battlefield in Afghanistan… We are at war with a stateless enemy, prone to shifting operations from country to country.”  That authority extends, he says, to killing US citizens without regard to geography or due process.

War changes society by limiting citizens’ rights.  Inspecting the private communications of citizens is routine during war, habeas corpus and due process are routinely suspended, and what would be assassination in time of peace becomes legal.  But if our war on terror never ends, our civil liberties and peacetime rules of law will never be restored.  They will be further eroded.

We are now, 12 years into this war, committing massive resources to missions that are not even clearly connected with preventing Islamist terrorism and we are making permanent what were introduced as emergency overrides on the Bill of Rights, e.g., the need to obtain a warrant for certain actions.

No nation can afford the dollar cost of permanent war or the spiritual cost of war that can never be won.  When we do take military action it should be with clear goals and sufficient force applied in a way that will achieve the goals.  Our present strategy has none of these attributes.

“If You Really Want to End Suffering,

it’s very simple,” Shugen Sensei told us at the start of our week of Zen Buddhist meditation: “Stop creating it.”  I’ll come back to that in a moment.  Just notice he did not say it’s easy.

Thinking why I blog reminded me of what Steve Jobs said is the secret to product development “Start somewhere”.  Just starting has always been my path.  Only later, sometimes much later, if what I started still feels worth doing, do I try to understand why.  The urge to figure out the why of Himalayan exploration, Buddhist practice, economic and governance research and blogging has now arrived.   To my surprise, it centers on ending suffering.

It all started ten years ago in the Himalayan mountains.  It wasn’t my idea to go there and I had no specific objective.  What happened was I found myself among people who appeared to be living with dignity, not aggressively, not hurriedly, and happily without the nice things we take for granted.  Could it be true?  Did they have a recipe my society might learn from?  So I kept going back.

I began to wonder if Buddhism was part of the recipe.   When we visited Buddhist temples our crew always lit lamps and prostrated.  But later, when we visited Hindu temples and the dwelling places of animist spirits, they showed reverence there, too.  I’d done some Buddhist reading by that time and was trying to meditate.  That’s why I went to the Zen monastery.

By the end of the first day I was pretty sure I’d made a mistake.  It was so hard to do nothing, sit completely still, just notice my thoughts, make no judgments, not reject or follow them.   By the end of the day I was exhausted although I’d “done” nothing.  I fell instantly asleep.  In the morning I thought, “I’ll see how it goes until breakfast”.   After breakfast I thought, “I’ll see if I can hang on ’til lunch”.  At day’s end I thought, “Maybe day three will be better“.   It was worse.  Day four was a little better, though, and so it went.  I’d suffered a lot by the end of the week but I’d also had glimpses of the truth of what Shugen Sensei told us at the start.  I was bringing my suffering onto myself.  That felt worth knowing.

Before I could go to the Himalayas I’d forced myself to retire.  It was hard because from then on, investments would have to support us.  With more time to worry, I realized my ignorance of how the economy works meant I had little confidence we’d made good investments.  So, when I wasn’t in the Himalayas I studied investment and economic theory.  The Great Recession arrived just as I was starting to feel I had the theories sufficiently clear.

Now I had to understand why our economy collapsed.  I studied governance and saw some parallels with the paralysis of government in Nepal.  That’s when I started blogging.  The US economy is embedded in the global economy.  There are so many moving parts in the system.  I had to start recording facts and analyses to get a holistic picture.  Charts and writing are my best tools for thinking and I hoped for critical feedback.

It’s only recently that I began to sense all these activities are related and they all start where Shugen Sensei was pointing.  They’re all aimed at happiness and stopping the creation of suffering.

The historical Buddha taught that we will only become truly happy when we work to end the suffering of others.  It must be so because we are not separate from others.  If they are unhappy we will also be made unhappy.  Communities were small two and a half thousand years ago.  People made each other happier or not with face to face interactions.   Today we also interact via nation-state and global systems that impact both us and future generations.  That’s why I care about governance.

The Federal Budget and GDP

I’ve come to think of charts like the ones in this post as cave paintings.  We must study them carefully to see what they reveal and also what their structural assumptions obscure.

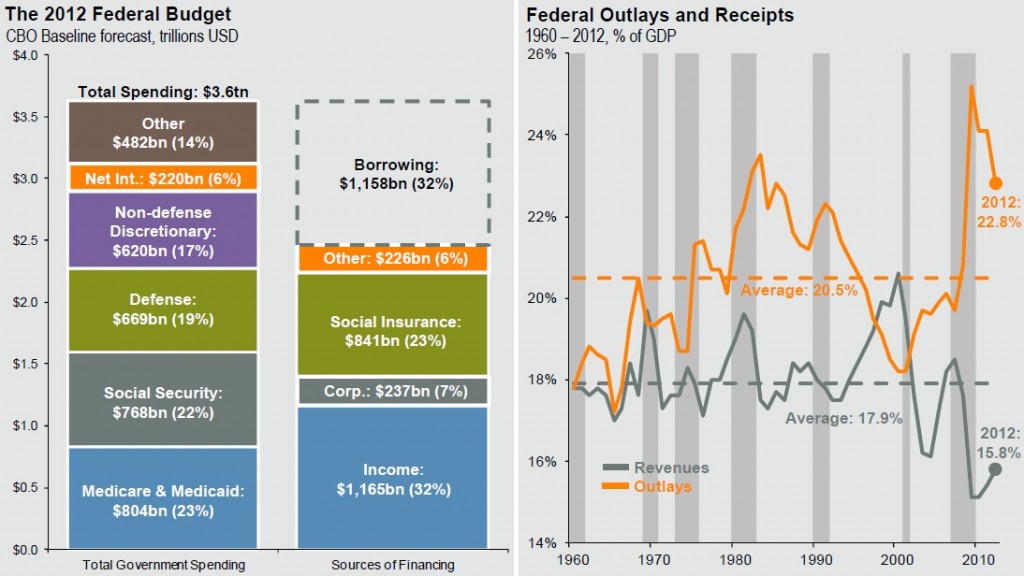
The bar chart shows we are financing  an enormous amount of Federal spending with borrowing – almost one third.  The line chart shows we spent more than revenue for most of the last half century and why the current imbalance is so enormous – the Great Recession.  As in previous recessions (indicated by darker bars), revenue fell starting in 2007/8 because incomes fell, and spending increased because unemployment increased.

federal-budget-2012

The line chart also shows revenue now heading up and spending down as in most post-recessionary times.  But here we start to wonder what we’re measuring.   It doesn’t feel like we’re out of recession.  Corporate profits are at an all-time high, the unemployment rate is a bit lower, it’s good news federal revenue and spending are heading in the right direction, but we don’t feel good.

The line chart also raises a question.  Spending fell after the early ’80s and early ’90s recessions.  Why did it increase before the most recent recession?  Largely because of a very costly unfunded new program initiated at that time, the War on Terror.

The bar chart shows only a little of what we need to understand.  A commercial enterprise with multiple lines of business (LOB) reviews each LOB’s revenue and spending individually.  This chart shows, or seems to show that for only a single Federal program, Social Security.  Since Social Insurance revenue at $841B is greater than Social Security spending at $768B, it looks to be in good shape.  But does what’s labelled “Social Insurance” revenue include Medicare as well as Social Security payroll tax?

Additional research would show that Social Security revenue is in fact greater than spending.  Digging deeper would show when that will reverse as well as the past and potential effects of adjusting the formulas that govern its revenue and spending.  As I noted in a previous post, it would, for example, show that raising the maximum wage on which S/Sec tax is withheld to its traditional real level would eliminate half the future imbalance.

The bar chart shows that the Federal Government’s borrowing costs at 6% of the total are relatively affordable at this time.  It also shows they will not be so if total spending continues to exceed revenue by such a wide margin, currently 32%.  We added $1,158B to our total debt in 2012 on which we paid $220B interest.

Questions the charts provokes but does not illuminate include:

  1. Why is Medicare/Medicaid spending so high at $804B and 23% of total spending, how much is its revenue, how can they be balanced?
  2. Why is Defense spending so high at $669B and 19% of total spending, how and by how much should it be cut?
  3. What makes up Non-Defense Discretionary Spending, are we over- or under-spending there?
  4. What makes up “Other” spending, are we over- or under-spending on elements of that?
  5. How can we best increase revenue to pay for spending we choose not to eliminate?
  6. Can we fix the federal spending/revenue imbalance with economic growth?

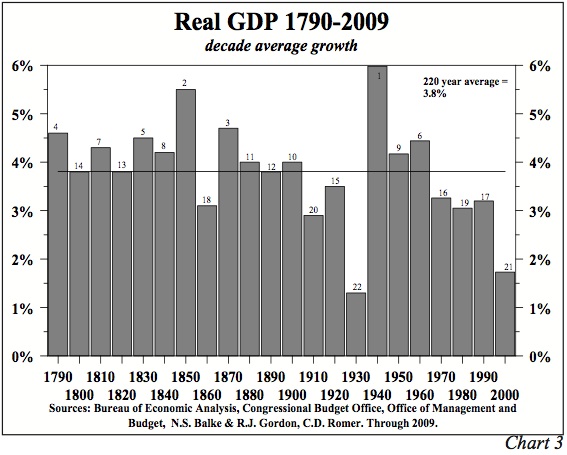
The next chart suggests the possibility of a positive answer to question 6.  Since our real economic growth in the most recent decade was at by far its lowest rate since the decade of the Great Depression, after which it grew rapidly, we could hope that experience will be repeated.

GDP Growth by Decade 1790 - 2009

The primary drivers of post-Great Depression GDP growth were spending on WW2 and on post-WW2 recovery programs including the GI Bill and mortgage subsidies.  Fortunately, WW3 seems unlikely in the near future so we need other ways to increase economic activity.  We must also answer at least the first two questions above, healthcare and defense costs.  The data is visible in cave paintings down those mine-shafts so we’ll take a flashlight and calculator as well as a canary to investigate.

The Canary and the Colly Bird

Colly birds are unexpectedly thought-provoking.  Learning that colly comes from the Old English col led me to the history of coal and other energy sources, how power shifts when it’s abused or new technology arrives, and differences between resource-extracting and self-sustaining economies.

Colliery work was very dangerous.  Workers who were not killed by mine shaft collapse, flooding, or explosive gas accidents died later from black-lung disease.  Mine owners in 19th century British held all the power and invested little in safety.   The workers could get no other jobs but they organized as the 20th century approached.  They balanced the owners’ power by striking and they got safer conditions.  In 1947 all mines were bought by the government.  The miners’ and other unions continued to gain power and make more demands via work stoppages that peaked in 1979 when over 29 million working days were lost.  In 1984, the miners stopped work for a year.  That cost the economy well over $2 billion but the government refused to negotiate and broke the unions’ power.  Stoppages were below 2 million working days by 1990.   The number of mine workers fell even more precipitously from over 700,000 in the 1940s to around 12,000 in 2002.

So, excessive power was abused first by the mine owners, then  the workers’ unions, then government gained the upper hand before re-privatizing the mines.  Union leaders got power when the workers were roused to desperate protest, then lost it when coal began to grow scarce and new technology eliminated the miners’ jobs.

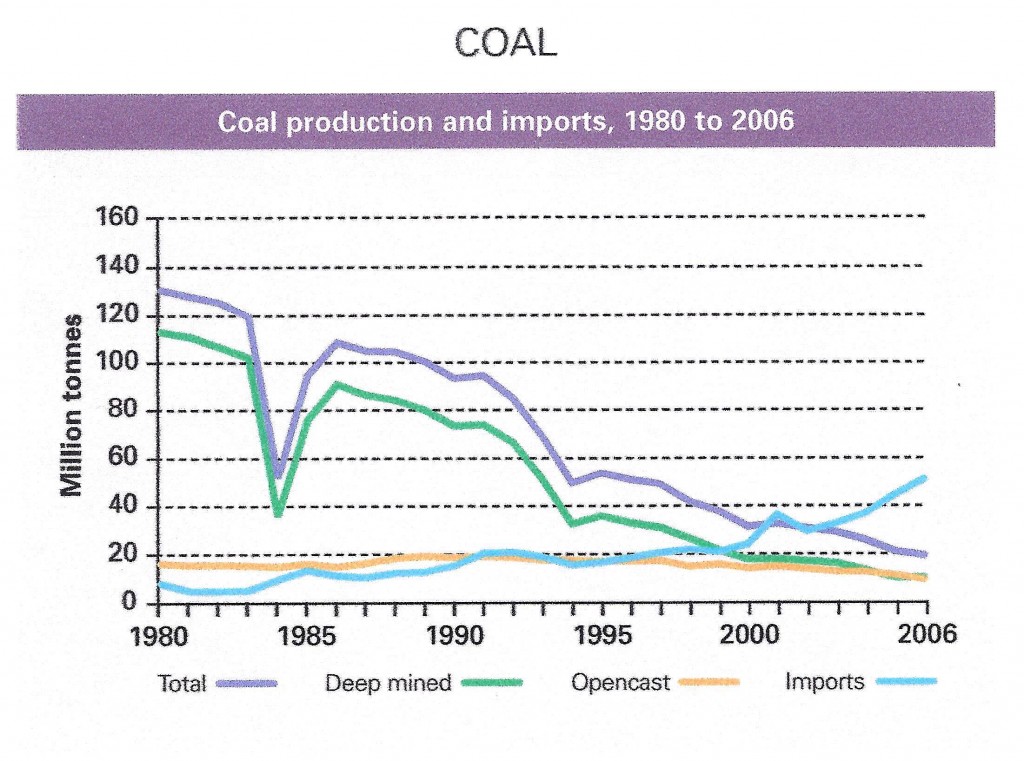
UK Coal Production

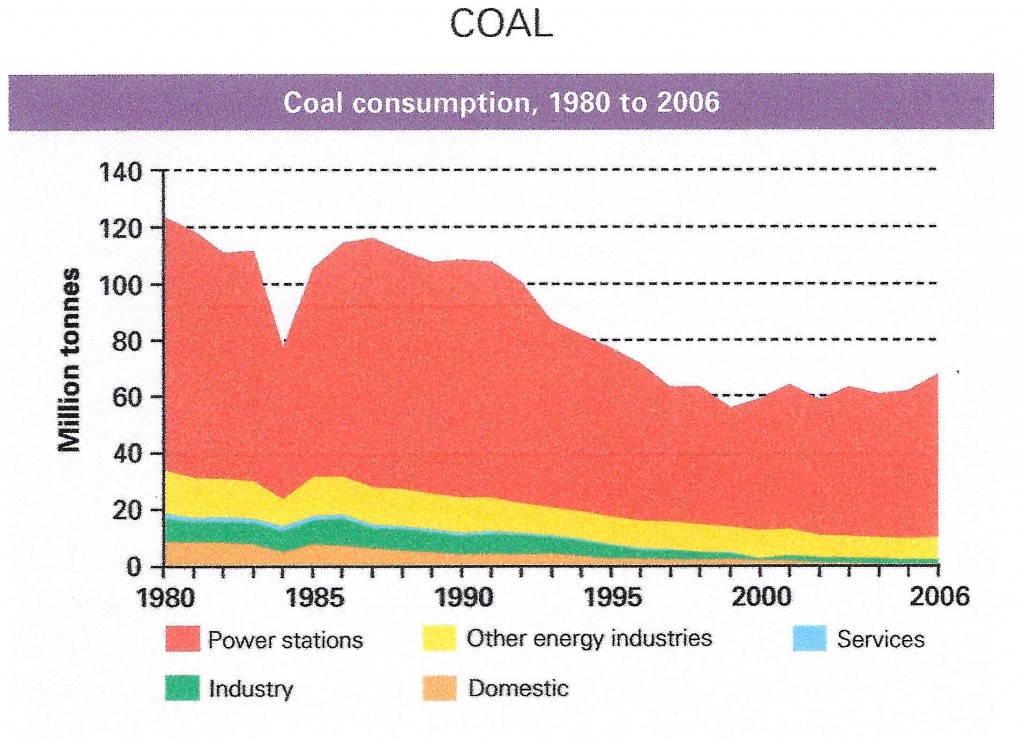
While UK coal production fell from 112 million tonnes in 1980 to 9 in 2006, coal consumption fell only from 123 million tonnes to a low of 59 million in 2000 after which it grew to 67 million in 2006.  The growth in demand for coal came from power stations that accounted for 86% of all UK coal consumption by 2006.  The drop in UK coal production was balanced by increased imports.

UK Coal Consumption

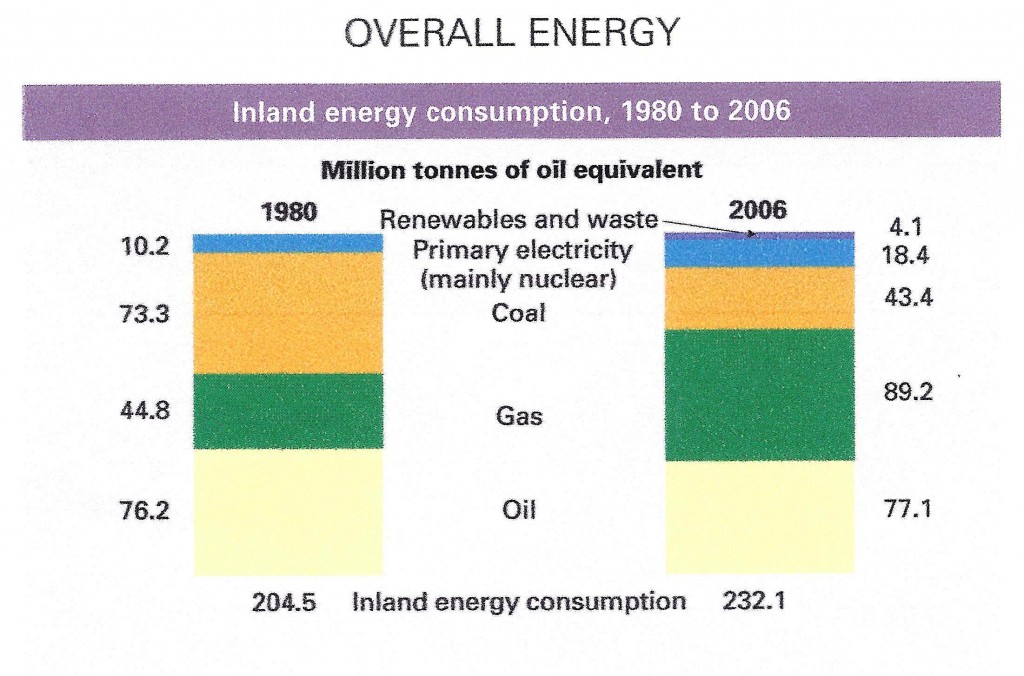
Overall UK energy use grew from 205 to 232 million tonnes of oil equivalent since 1980.  Oil use was roughly constant, coal dropped and use of natural gas doubled.

UK Energy Use

In the USA, where I found longer term data, there is much higher dependence on oil, coal still is as important as natural gas and, as in the UK, although production from renewable sources is increasing, it is still only a small fraction of the total.  I’ll return in a future post to energy use and its implications for economies and societies but first, why did I mention the canary?

US_historical_energy_consumption

Canaries were used in British coal mines from 1911 to 1987 as an early warning system.  Carbon monoxide, methane and other toxic gases in the mine shaft would kill a canary before affecting the miners.  Its signs of distress alerted the miners to escape.  It occurred to me that our house was heated by coal when I was a kid and I liked that but I knew nothing about conditions in the mines.  Could there be  mine-shafts in our economy now where great wealth is being extracted and toxicity is building up?  I felt I should take a canary to investigate.

And why colly birds again?  Because they and other birds in the song were rich folks’ food.  The audience for and singers of the song were being promised those things.  We tend to overlook toxic by-products of rich folks’ things because we like to imagine that we, too, could be rich.  That makes us vulnerable to contemporary equivalents of the Monty Python pet store salesman who insisted the deceased Norwegian Blue parrot he sold was not dead but resting, pining for the fjords or momentarily stunned, or the 4th century Greek man complaining to a slave-merchant that his new slave died who was told: “When he was with me, he never did any such thing!”  Those jokes work because we really are vulnerable to such nonsense.

We should always, but rarely do, consider incentives.  To understand a business’ sales results, understand its sales folks’ comp plan.  To understand a society, understand the basis of its economy.  Resource-extracting endeavors like coal mining encourage owners to make their one-time harvest as fast and profitably as possible.  Self-sustaining enterprises like Nepali hill farms that require terraces to be maintained for food this year also enable them to raise crops next year, and their descendants in future years.  The different bases of the two economies drive short-term-only or short-and-long-term-optimizing behaviors.

Coal mining and subsistence farming are illustrations.  I’m no romantic about village life.  My sheep needed care every day; care in bad weather, intensive care in lambing season, care when I was sick, care that must be expert or they would die.  It’s hard and stressful work that never ends and sheep die in disasters no matter what.  There are much easier ways to support oneself.  All I’m saying is we should notice negative side-effects of the way we live and consider if there are better ways.

So, in future posts I will take a canary down some jointly-owned, private-public mine-shafts that are disproportionately rewarding for their owners and harmful to others.  Four that seem especially problematic are the:

  • Miilitary-industrial mine-shaft that keeps us in a ruinously costly perpetual state of war
  • Washington-Big Oil mine-shaft that keeps us in a military trap in the Middle East and keeps climate change off our agenda
  • Washington-healthcare industry mineshaft, our largest at 17% of GDP, which costs us twice as much as in any other rich country and makes us the only one without universal healthcare
  • Washington-Wall Street one that supplies almost every US Treasury secretary and paved the way for financial crisis, mega-bailouts and not a single prosecution of criminals.

I will also explore the economic and social impact of technology.   The UK coal miners who improved their lives by increasing their relative power later lost their livelihood to new machines.  New technologies like that can greatly increase capital returns by replacing human labor, which increases unemployment and pushes down wages.  That cuts society’s ability to pay for the newly automated products and services, and everything else.

I will try to shed light on how governments can respond to:

  • A great imbalance of power in part of the economy
  • New technologies that will have disruptive economic and social impact.

Trends that Cannot Continue

Pragmatic conservative Herbert Stein gave us the Law: “If something cannot go on forever, it will stop”.  What that implies is, actions will be taken.  It also implies they are unlikely to be immediate.

On Dec. 3, shortly before the “Fiscal Cliff”, the Government Accountability Office (GAO)  released new estimates of the federal government’s long-term budget outlook.   These numbers will not be changed much by the deal Congress so embarrassingly arrived at just after we went off the cliff.  We are still following trends that cannot continue.

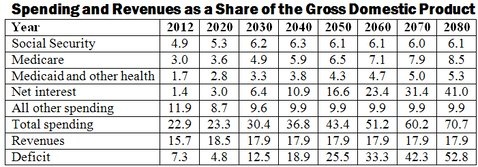
Examining them in the order they appear in the table below; first Social Security (S/Sec).  Spending will grow by almost a quarter as a % of GDP as baby boomers retire and average life expectancy continues to increase, then stabilize at that level.  S/Sec revenue is at this time higher than spending but that will not continue if no action is taken.  S/Sec tax used to be levied on 90% of covered earnings.  That has fallen to 84% because most wage gains in recent years went to those making more than the maximum taxable income.  Raising the maximum so the share of covered earnings goes back to 90% would eliminate almost half of S’Sec’s projected long-term deficit.  Other small changes would fix the rest of the potential problem.

Spending & Revenue vs GDP

“Medicare, Medicaid and other health” spending now totals 4.7% of GDP, almost the same as S/Sec.  But at 8.2% it has almost doubled by 2030 then it continues to climb steadily to just under three times today’s level six decades out.   That’s the good news.  The bad news is our total healthcare spending is 17% of GDP.   “Medicare, Medicaid and other health” spending is barely a quarter of the total.  Medicare spending will grow as a higher % of our population reaches 65, and Medicaid will grow unless wages increase at the low end and unemployment drops, but those increases are relatively small in the context of our overall healthcare system.

We spend twice as much per capita on healthcare as the next highest nation, 48 million Americans have no health insurance, and other first world nations get better healthcare results.  If the 8.2% of GDP we’re projected to spend on “Medicare, Medicaid and other” in 2030 was our total healthcare spend, we’d be in great shape but it’s nowhere close.  Although the rate of increase for “Medicare etc” does not need to be cut drastically and it must be done, our healthcare system is far from easy to change.

Bypassing net interest for a moment, we find “All other spending” falls.  It will be worthwhile to examine some line items inside this category in another post.  Is it, for example, a good plan to keep cutting spending on education?  Is it a good plan to continue making war in Afghanistan?  Those questions and more are for another day.

By far the greatest problem revealed by the GAO analysis is how our growing annual deficit drives an insane rate of growth in interest costs.  The deficit grows because while spending increases steadily at rates that are too high but not alarmingly so, revenue stays at its historical average around 18% of GDP.   That drives ever increasing  cumulative debt, the interest on which more than doubles from 1.4% of GDP this year to 3% in 2020 and is almost five times as high only a decade later.  Even those numbers are only if the federal government continues to be able to borrow at 1.3% through 2017 and 3.7% in the long run, which is not possible.

Stein’s Law tells us that because the deficit cannot continue to grow as it does in the GAO’s projection, it will not.  The reason it reaches the impossible height in this projection is because relatively small growth in big spending programs like S/Sec and Medicare compounds into big numbers.  In the same way, relatively small changes in the growth rate of those programs would result in big long term changes in the deficit.

And therein lies the problem.  The Congress that raises taxes and cuts benefits will suffer politically.  Future Congresses will be the ones to get the benefits of lower deficits.  If today’s Congress does not take action, future Congresses will be forced to respond to their society’s pain from high inflation and/or high interest rates.   But we in today’s society are not feeling those pains, so there’s no motivation to act now.  What we are suffering from is low growth but there’s no quick fix for that and many ways we might attack the deficit would likely cut growth more.

Congressional inactivity is something that cannot go on forever but it looks unlikely to stop soon.  They blundered over the fiscal cliff.  I expect them to blunder through at least the next debt ceiling.  Deficit reduction is not likely in the near term.

Note:  The GAO document is at http://www.gao.gov/assets/660/650466.pdf

“Four Colly Birds,

three French hens, two turtledoves and a partridge in a pear tree.”  This old Christmas song was written when the blackbird was food along with the hen, turtledove and partridge.  Colly in Old English means ‘black’ hence ‘colliery’ meaning coal mine and colly bird meaning blackbird.  Blackbirds were gourmet food in those days.  In “Sing a Song of Sixpence” 24 of them are baked in a pie.  So here, as thought-provoking fare, are four colly charts.

Fed Tax and Spending vs GDP

The first one shows Federal spending, the red line, and revenue (taxes), the blue one, in relation to GDP, the overall economy.  Spending is now 24% of GDP, higher than its ~22% average for the past few decades while revenue is substantially lower than spending at 17% of GDP and lower than its ~19% average over the past few decades.  This chart illustrates two of our three big problems, too high spending and too low taxes.  Our third problem (which I haven’t illustrated because I want only four charts) is economic growth that’s too slow to grow us out of the revenue and spending problems.   Slamming on the brakes to fix the deficit would make all three problems worse.

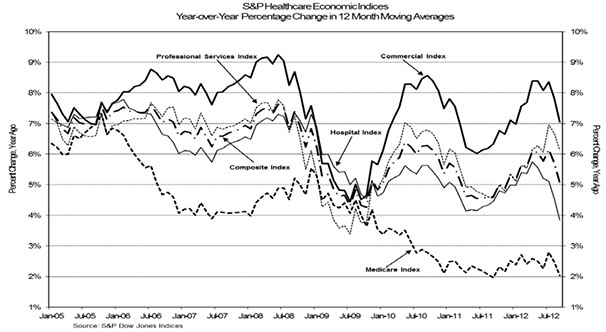
Health Care Indices

Where to cut spending?  Medicare?  We keep hearing that’s out of control.  The second chart suggests otherwise while also showing that our overall healthcare spending is unsustainable .  Medicare spending is now growing at an annual rate of 2%, right around the upper end of forecast GDP growth.  It was more than 7% six years ago.  Overall healthcare spending, however, (the composite index), which was also increasing 7% then is still growing 6% to 7%, an unaffordable burden on our economy.  Cutting Medicare, the only part of our healthcare system that is growing at an affordable rate, would increase that burden.

Labor vs Capital Share of Nonfarm Business

Where to raise revenue?  Wage-earners?  The third chart shows that after holding fairly steady at around 65% for the half century following WW2, labor’s share of non-farm business spending has, for more than a decade, been dropping fast.  It’s now around 57%.  What is correspondingly growing is capital spending.  Workers of all kinds are being replaced by computers and robots, not just by lower paid workers in other countries.  They, too, are being replaced by technology.  Capital investment is especially favorable now because interest rates have been driven so low.

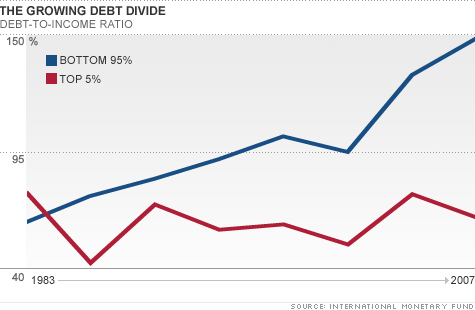
Debt v Income Tp and Bottom Quintile

The fourth chart shows that even though low interest rates are attractive to all spenders (especially governments), they are not helping everyone equally.  Debt (also interest payments, therefore) as a percentage of income is growing rapidly for those with incomes in the bottom 5%.  That’s because their living expenses keep growing but their incomes do not.  That will not change for the better in a very slowly growing economy.

Conclusions: (1)  Here, too, there is no silver bullet.  (2) We’ll shoot ourselves in the foot (at best) if we act as if there is one.